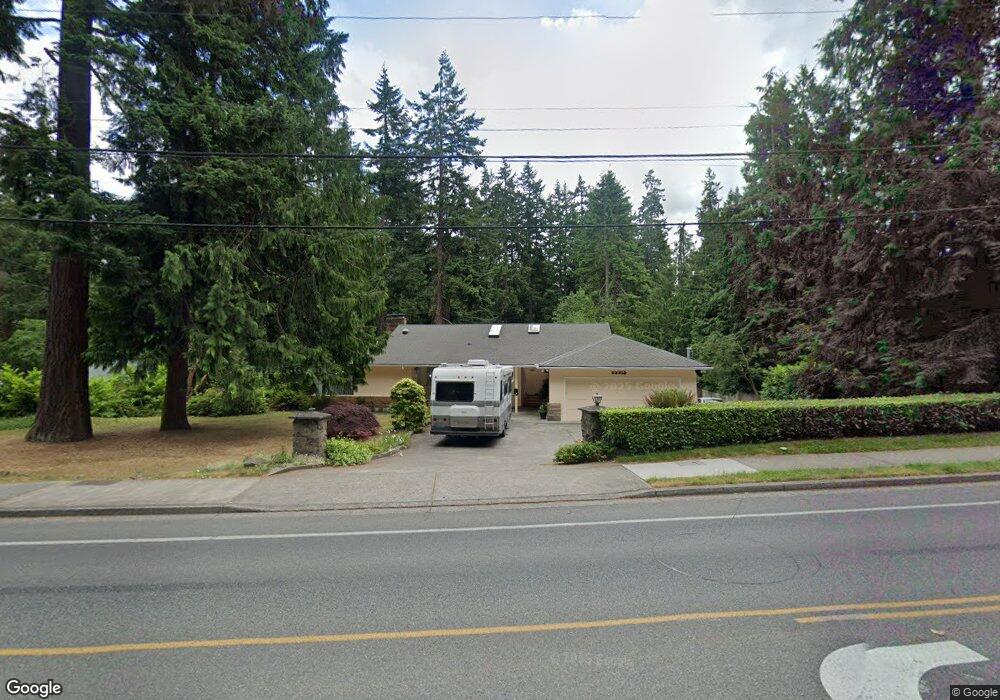
23311 100th Ave W Edmonds, WA 98020
Sherwood Forest NeighborhoodEstimated Value: $933,000 - $997,000
3
Beds
2
Baths
4,004
Sq Ft
$243/Sq Ft
Est. Value
About This Home
This home is located at 23311 100th Ave W, Edmonds, WA 98020 and is currently estimated at $971,750, approximately $242 per square foot. 23311 100th Ave W is a home located in Snohomish County with nearby schools including Sherwood Elementary School, College Place Middle School, and Edmonds-Woodway High School.
Ownership History
Date
Name
Owned For
Owner Type
Purchase Details
Closed on
Nov 13, 2012
Sold by
Choi Sung Hye and Choi Byung Kuk
Bought by
Choi Won Sik and Hwang Claudia Sunnyo
Current Estimated Value
Purchase Details
Closed on
Dec 3, 2002
Sold by
Chung Mook and Chung Kyung Ok
Bought by
Choi Byung Kuk and Choi Sung Hye
Home Financials for this Owner
Home Financials are based on the most recent Mortgage that was taken out on this home.
Original Mortgage
$207,200
Outstanding Balance
$85,023
Interest Rate
5.62%
Estimated Equity
$886,727
Purchase Details
Closed on
Dec 16, 1998
Sold by
Denham Robert W and Denham Cathy J
Bought by
Chung Mook and Chung Kyung
Home Financials for this Owner
Home Financials are based on the most recent Mortgage that was taken out on this home.
Original Mortgage
$171,200
Interest Rate
6.86%
Purchase Details
Closed on
Dec 21, 1995
Sold by
Denham Richard W and Denham Yvonne G
Bought by
Denham Robert W and Denham Cathy J
Home Financials for this Owner
Home Financials are based on the most recent Mortgage that was taken out on this home.
Original Mortgage
$160,000
Interest Rate
7.37%
Create a Home Valuation Report for This Property
The Home Valuation Report is an in-depth analysis detailing your home's value as well as a comparison with similar homes in the area
Home Values in the Area
Average Home Value in this Area
Purchase History
| Date | Buyer | Sale Price | Title Company |
|---|---|---|---|
| Choi Won Sik | -- | None Available | |
| Choi Byung Kuk | $296,000 | Chicago | |
| Chung Mook | $214,000 | -- | |
| Denham Robert W | $170,000 | -- |
Source: Public Records
Mortgage History
| Date | Status | Borrower | Loan Amount |
|---|---|---|---|
| Open | Choi Byung Kuk | $207,200 | |
| Previous Owner | Chung Mook | $171,200 | |
| Previous Owner | Denham Robert W | $160,000 |
Source: Public Records
Tax History Compared to Growth
Tax History
| Year | Tax Paid | Tax Assessment Tax Assessment Total Assessment is a certain percentage of the fair market value that is determined by local assessors to be the total taxable value of land and additions on the property. | Land | Improvement |
|---|---|---|---|---|
| 2025 | $5,895 | $844,500 | $559,600 | $284,900 |
| 2024 | $5,895 | $827,100 | $542,200 | $284,900 |
| 2023 | $6,150 | $894,200 | $566,500 | $327,700 |
| 2022 | $5,765 | $689,300 | $438,400 | $250,900 |
| 2020 | $5,495 | $587,600 | $344,400 | $243,200 |
| 2019 | $5,136 | $553,200 | $316,200 | $237,000 |
| 2018 | $5,175 | $481,700 | $269,700 | $212,000 |
| 2017 | $4,415 | $430,000 | $233,800 | $196,200 |
| 2016 | $4,063 | $397,300 | $206,600 | $190,700 |
| 2015 | $3,907 | $359,700 | $197,900 | $161,800 |
| 2013 | $3,058 | $265,900 | $133,900 | $132,000 |
Source: Public Records
Map
Nearby Homes
- 9801 234th St SW Unit 1
- 23024 99th Ave W
- 9526 234th St SW
- 23511 96th Ave W
- 9511 Edmonds Way
- 23227 92nd Ave W
- 24012 102nd Place W
- 23121 Edmonds Way Unit 2
- 22910 90th Ave W Unit C306
- 23015 Edmonds Way Unit A103
- 22628 106th Ave W
- 8825 231st Place SW
- 23601 Edmonds Way
- 24104 105th Place W
- 24109 106th Place W
- 9906 242nd Place SW
- 22212 98th Ave W
- 11211 Wachusett Rd
- 11130 S Deer Dr
- 22039 98th Place W
- 23309 100th Ave W
- 23315 100th Ave W
- 9921 234th St SW
- 9915 234th St SW
- 23305 100th Ave W
- 9931 234th St SW
- 9903 234th St SW
- 23217 100th Ave W
- 9831 234th St SW
- 23303 100th Ave W
- 9825 234th St SW
- 23402 99th Place W
- 9828 232nd St SW
- 9906 232nd St SW
- 9819 234th Place SW
- 9805 234th St SW
- 23404 99th Place W
- 9817 234th Place SW
- 9809 234th St SW
- 23230 98th Ave W