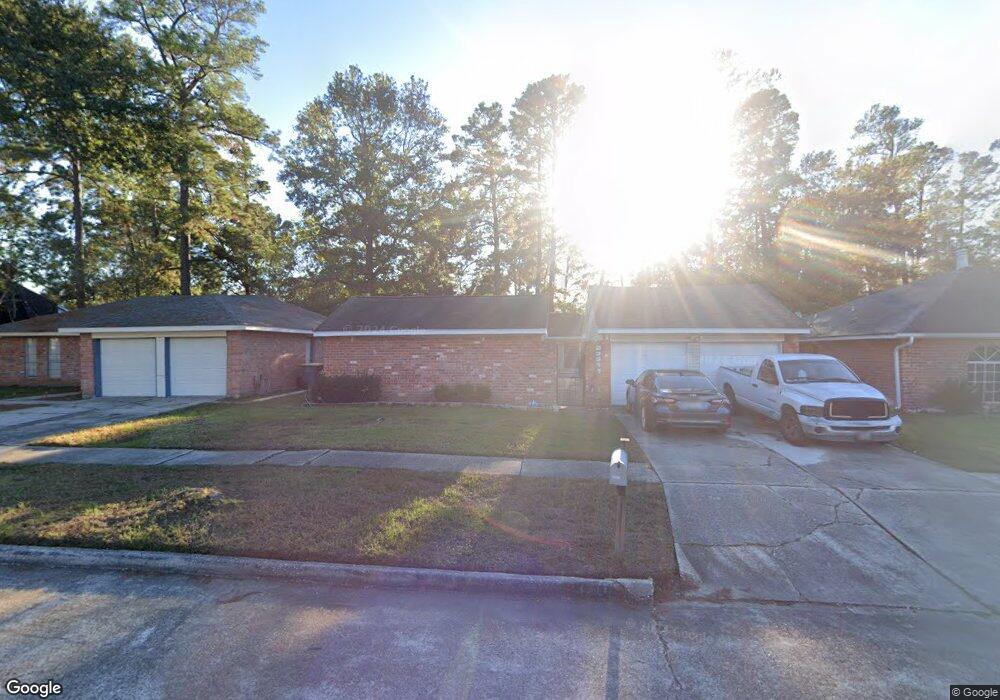
23311 Tree Bright Ln Spring, TX 77373
Estimated Value: $220,040 - $228,000
3
Beds
2
Baths
1,708
Sq Ft
$131/Sq Ft
Est. Value
About This Home
This home is located at 23311 Tree Bright Ln, Spring, TX 77373 and is currently estimated at $224,260, approximately $131 per square foot. 23311 Tree Bright Ln is a home located in Harris County with nearby schools including Chet Burchett Elementary School, Dueitt Middle School, and Spring High School.
Ownership History
Date
Name
Owned For
Owner Type
Purchase Details
Closed on
Jul 20, 2017
Sold by
Sway 2014 1 Borrower Llc
Bought by
Aldaco Aldaco and Aldaco Frances Barrientez
Current Estimated Value
Home Financials for this Owner
Home Financials are based on the most recent Mortgage that was taken out on this home.
Original Mortgage
$121,507
Outstanding Balance
$103,554
Interest Rate
4.87%
Mortgage Type
FHA
Estimated Equity
$120,706
Purchase Details
Closed on
Feb 20, 2014
Sold by
Srp Sub Llc
Bought by
Tarbert Llc
Purchase Details
Closed on
Jun 17, 2013
Sold by
Rio Maria Del
Bought by
Srp Sub Llc
Purchase Details
Closed on
Apr 20, 2007
Sold by
Nikel Lawrence K
Bought by
Delrio Maria
Home Financials for this Owner
Home Financials are based on the most recent Mortgage that was taken out on this home.
Original Mortgage
$103,562
Interest Rate
6.1%
Mortgage Type
Purchase Money Mortgage
Create a Home Valuation Report for This Property
The Home Valuation Report is an in-depth analysis detailing your home's value as well as a comparison with similar homes in the area
Home Values in the Area
Average Home Value in this Area
Purchase History
| Date | Buyer | Sale Price | Title Company |
|---|---|---|---|
| Aldaco Aldaco | -- | None Available | |
| Tarbert Llc | -- | -- | |
| Tarbert Llc | -- | -- | |
| Srp Sub Llc | $70,500 | None Available | |
| Delrio Maria | -- | Chicago Title Insurance Co |
Source: Public Records
Mortgage History
| Date | Status | Borrower | Loan Amount |
|---|---|---|---|
| Open | Aldaco Aldaco | $121,507 | |
| Previous Owner | Delrio Maria | $103,562 |
Source: Public Records
Tax History
| Year | Tax Paid | Tax Assessment Tax Assessment Total Assessment is a certain percentage of the fair market value that is determined by local assessors to be the total taxable value of land and additions on the property. | Land | Improvement |
|---|---|---|---|---|
| 2025 | $4,820 | $211,398 | $51,168 | $160,230 |
| 2024 | $4,820 | $203,179 | $51,168 | $152,011 |
| 2023 | $4,820 | $203,913 | $51,168 | $152,745 |
| 2022 | $4,441 | $180,536 | $35,942 | $144,594 |
| 2021 | $3,701 | $143,059 | $14,976 | $128,083 |
| 2020 | $3,583 | $133,775 | $14,976 | $118,799 |
| 2019 | $3,651 | $132,521 | $14,040 | $118,481 |
| 2018 | $3,416 | $113,100 | $14,040 | $99,060 |
| 2017 | $3,113 | $113,100 | $14,040 | $99,060 |
| 2016 | $3,114 | $113,115 | $14,040 | $99,075 |
| 2015 | $1,632 | $99,996 | $14,040 | $85,956 |
| 2014 | $1,632 | $83,933 | $14,040 | $69,893 |
Source: Public Records
Map
Nearby Homes
- 5918 Crooked Post Rd
- 23110 Pennsgrove Rd
- 6007 Knotty Post Ln
- 5407 Rushstone Ln
- 23022 Laketree Ln
- 5311 Oaklynn Dr
- 5414 Sweetwind Ln
- 5402 Sherrylee Ln
- 4910 Treaschwig Rd
- 5314 Sweetwind Ln
- 5414 Honeybear Ln
- 5311 Sweetwind Ln
- 6031 Crooked Post Rd
- 23227 Pine Post Ln
- 23206 Goodfellow Dr
- 6126 Knotty Post Ln
- 5410 Dibello Forest Ln
- 5023 Glendower Dr
- 5031 Monteith Dr
- 22727 Paradise Gate Dr
- 23315 Tree Bright Ln
- 23307 Tree Bright Ln
- 23319 Tree Bright Ln
- 23303 Tree Bright Ln
- 23310 Tree Bright Ln
- 23306 Tree Bright Ln
- 23314 Tree Bright Ln
- 23219 Tree Bright Ln
- 23323 Tree Bright Ln
- 23302 Tree Bright Ln
- 23318 Tree Bright Ln
- 23215 Tree Bright Ln
- 23218 Tree Bright Ln
- 23322 Tree Bright Ln
- 23326 Tree Bright Ln
- 23214 Tree Bright Ln
- 23311 Good Dale Ln
- 23211 Tree Bright Ln
- 23315 Good Dale Ln
- 23327 Tree Bright Ln
Your Personal Tour Guide
Ask me questions while you tour the home.