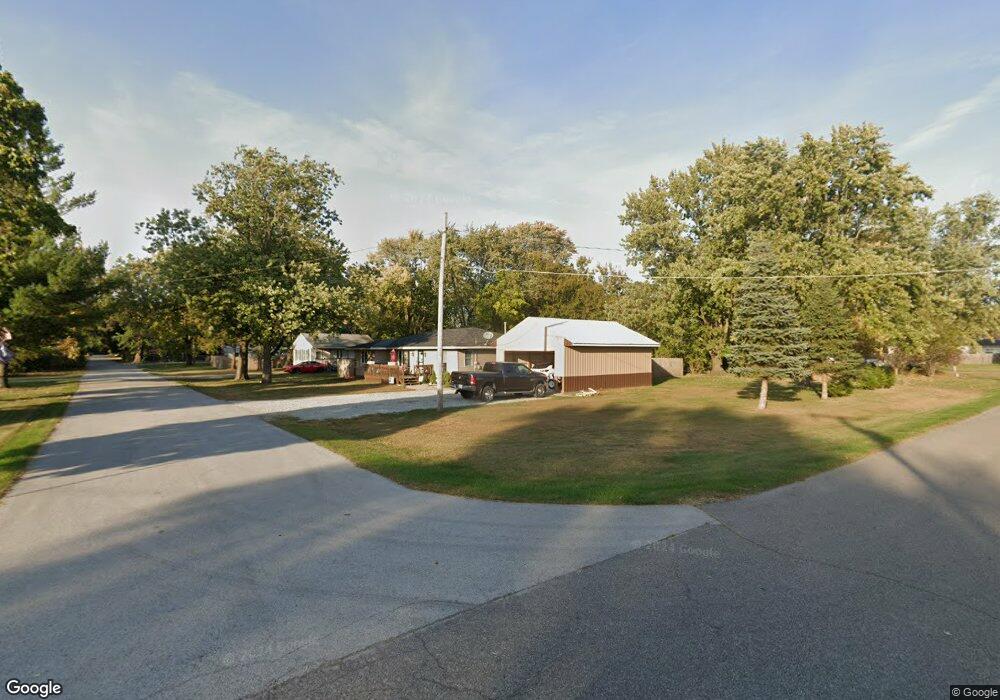
23317 Fillmore St Shelby, IN 46377
Cedar Creek NeighborhoodEstimated Value: $185,000 - $255,000
3
Beds
2
Baths
1,758
Sq Ft
$126/Sq Ft
Est. Value
About This Home
This home is located at 23317 Fillmore St, Shelby, IN 46377 and is currently estimated at $221,120, approximately $125 per square foot. 23317 Fillmore St is a home located in Lake County with nearby schools including Lowell Middle School and Lowell Senior High School.
Ownership History
Date
Name
Owned For
Owner Type
Purchase Details
Closed on
Oct 5, 2023
Sold by
Cross Jamee and Cross Rhonda G
Bought by
Cross Kevin I and Cross Tracy S
Current Estimated Value
Purchase Details
Closed on
Sep 20, 2023
Sold by
Cross Jamee and Cross Rhonda G
Bought by
Cross Kevin I and Cross Tracy S
Purchase Details
Closed on
Oct 18, 2022
Sold by
Cross James P and Cross Rhonda G
Bought by
Cross Kevin I and Cross Tracy S
Purchase Details
Closed on
Mar 4, 2005
Sold by
Stowell Ernest J and Estate Of Virginia M Steele
Bought by
Cross Jamee P and Cross Rhonda G
Create a Home Valuation Report for This Property
The Home Valuation Report is an in-depth analysis detailing your home's value as well as a comparison with similar homes in the area
Home Values in the Area
Average Home Value in this Area
Purchase History
| Date | Buyer | Sale Price | Title Company |
|---|---|---|---|
| Cross Kevin I | -- | None Listed On Document | |
| Cross Kevin I | -- | None Listed On Document | |
| Cross Kevin I | -- | None Listed On Document | |
| Cross Jamee P | -- | Chicago Title Insurance Comp |
Source: Public Records
Tax History Compared to Growth
Tax History
| Year | Tax Paid | Tax Assessment Tax Assessment Total Assessment is a certain percentage of the fair market value that is determined by local assessors to be the total taxable value of land and additions on the property. | Land | Improvement |
|---|---|---|---|---|
| 2024 | $2,865 | $150,700 | $24,300 | $126,400 |
| 2023 | $2,436 | $148,200 | $24,300 | $123,900 |
| 2022 | $2,436 | $146,300 | $22,600 | $123,700 |
| 2021 | $1,465 | $90,000 | $17,500 | $72,500 |
| 2020 | $1,407 | $89,300 | $17,500 | $71,800 |
| 2019 | $1,404 | $82,500 | $17,500 | $65,000 |
| 2018 | $1,353 | $79,400 | $17,500 | $61,900 |
| 2017 | $1,129 | $61,800 | $17,500 | $44,300 |
| 2016 | $1,130 | $63,900 | $17,500 | $46,400 |
| 2014 | $1,094 | $63,800 | $17,500 | $46,300 |
| 2013 | $1,118 | $63,200 | $17,500 | $45,700 |
Source: Public Records
Map
Nearby Homes
- 23503 Shelby Rd
- 23102 Pierce St
- 924 Fillmore St
- 1117 Island Dr
- 2549 E 1100 N
- 2555 E 1071 N
- 2790 E 1059 N
- 0 St Road 55
- 11327 N 550 E Unit 7
- 10955 NW Makeever Dr
- 10447 N 477 E
- 4827 E 1040 N
- 5338 E Lawler Ct Unit 67
- 10901 N 555 E
- 9260 N 225 E
- 9691 N Ahlgrim St
- 9176 N 200 E
- 0 E St Rd 10 Unit NRA822456
- 0 Porter St Unit NRA824217
- 11535 Sandhill Trail
- 1010 W 233rd Place
- 23309 Fillmore St
- 917 W 233rd Ave
- 917 233rd Ave
- 23316 Filmore St
- 1015 233rd Ave
- 1011 W 233rd Ave
- 1011 W 233rd Ave
- 23314 Fillmore St
- 23320 Filmore St
- 1103 W 233rd Ave
- 23312 Tyler St
- 404 W 233rd Ave
- 23308 Tyler St
- 23605-apprx Harrison
- 800 W 234th Ave
- 23233 Tyler St
- 23322 Filmore St
- 1115 W 233rd Ave