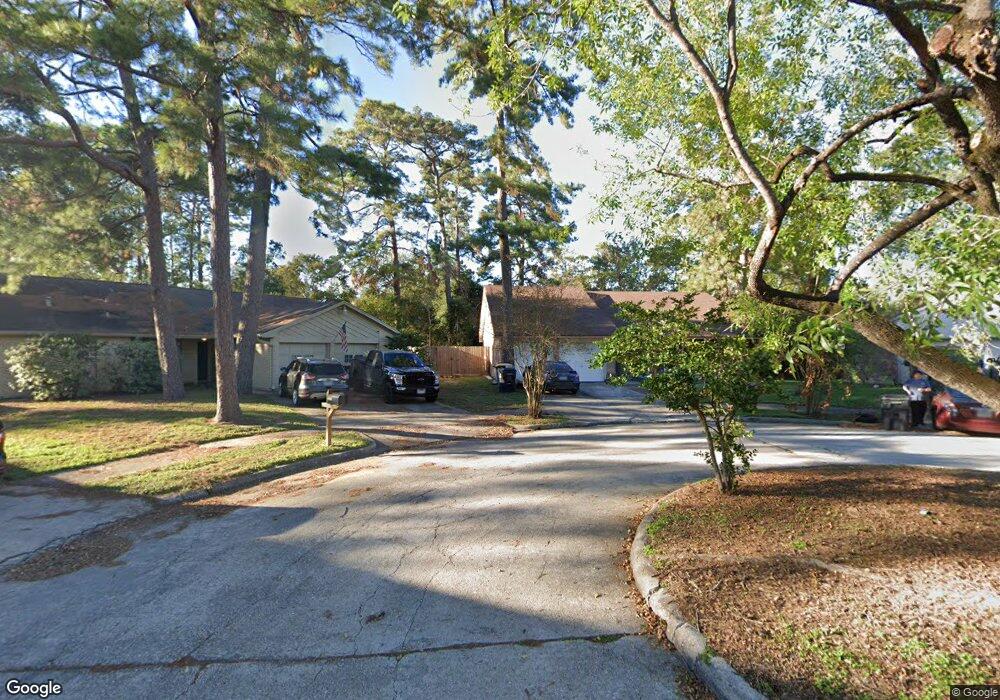
23318 Calico Corners Ln Spring, TX 77373
Estimated Value: $208,000 - $235,000
3
Beds
2
Baths
1,898
Sq Ft
$117/Sq Ft
Est. Value
About This Home
This home is located at 23318 Calico Corners Ln, Spring, TX 77373 and is currently estimated at $221,595, approximately $116 per square foot. 23318 Calico Corners Ln is a home located in Harris County with nearby schools including Chet Burchett Elementary School, Dueitt Middle School, and Spring High School.
Ownership History
Date
Name
Owned For
Owner Type
Purchase Details
Closed on
Nov 25, 2008
Sold by
Champion Anna and Champion Alejandro
Bought by
Aranda Antonio
Current Estimated Value
Home Financials for this Owner
Home Financials are based on the most recent Mortgage that was taken out on this home.
Original Mortgage
$96,529
Interest Rate
4.92%
Mortgage Type
FHA
Purchase Details
Closed on
Dec 15, 1994
Sold by
Va
Bought by
Champion Alejandro and Champion Anna M
Home Financials for this Owner
Home Financials are based on the most recent Mortgage that was taken out on this home.
Original Mortgage
$74,690
Interest Rate
9.07%
Mortgage Type
Seller Take Back
Purchase Details
Closed on
Dec 7, 1993
Sold by
Dabbs Kenneth D
Bought by
Va
Create a Home Valuation Report for This Property
The Home Valuation Report is an in-depth analysis detailing your home's value as well as a comparison with similar homes in the area
Home Values in the Area
Average Home Value in this Area
Purchase History
| Date | Buyer | Sale Price | Title Company |
|---|---|---|---|
| Aranda Antonio | -- | Texas American Title Co | |
| Champion Alejandro | -- | -- | |
| Va | -- | -- |
Source: Public Records
Mortgage History
| Date | Status | Borrower | Loan Amount |
|---|---|---|---|
| Previous Owner | Aranda Antonio | $96,529 | |
| Previous Owner | Champion Alejandro | $74,690 |
Source: Public Records
Tax History
| Year | Tax Paid | Tax Assessment Tax Assessment Total Assessment is a certain percentage of the fair market value that is determined by local assessors to be the total taxable value of land and additions on the property. | Land | Improvement |
|---|---|---|---|---|
| 2025 | $5,502 | $242,128 | $54,445 | $187,683 |
| 2024 | $5,502 | $231,947 | $54,445 | $177,502 |
| 2023 | $5,502 | $232,859 | $54,445 | $178,414 |
| 2022 | $4,120 | $206,546 | $38,244 | $168,302 |
| 2021 | $3,938 | $163,761 | $15,935 | $147,826 |
| 2020 | $3,707 | $151,872 | $15,935 | $135,937 |
| 2019 | $3,467 | $151,872 | $15,935 | $135,937 |
| 2018 | $2,700 | $140,098 | $15,935 | $124,163 |
| 2017 | $2,863 | $140,098 | $15,935 | $124,163 |
| 2016 | $2,602 | $122,612 | $15,935 | $106,677 |
| 2015 | $1,857 | $115,333 | $15,935 | $99,398 |
| 2014 | $1,857 | $95,165 | $15,935 | $79,230 |
Source: Public Records
Map
Nearby Homes
- 5314 Sweetwind Ln
- 5311 Sweetwind Ln
- 5414 Sweetwind Ln
- 23206 Goodfellow Dr
- 5407 Rushstone Ln
- 5031 Monteith Dr
- 5410 Dibello Forest Ln
- 5027 Monteith Dr
- 4314 Wyanngate Dr
- 5023 Glendower Dr
- 5002 Maurita Dr
- 5311 Oaklynn Dr
- 4922 Glendower Dr
- 5402 Sherrylee Ln
- 23022 Laketree Ln
- 5015 Yellow Ginko Trail
- 5414 Honeybear Ln
- 4707 Glendower Dr
- 23531 Montague Dr
- 23502 Glenbuck St
- 23315 Calico Corners Ln
- 5302 Sweetwind Ln
- 23314 Calico Corners Ln
- 5310 Sweetwind Ln
- 5214 Sweetwind Ln
- 23310 Calico Corners Ln
- 5210 Sweetwind Ln
- 23318 Dew Wood Ln
- 23322 Dew Wood Ln
- 23322 Dew Wood Ln
- 23314 Dew Wood Ln
- 5402 Sweetwind Ln
- 23326 Dew Wood Ln
- 23307 Calico Corners Ln
- 23306 Calico Corners Ln
- 23310 Dew Wood Ln
- 23330 Dew Wood Ln
- 5410 Sweetwind Ln
- 5307 Sweetwind Ln
- 5303 Sweetwind Ln
Your Personal Tour Guide
Ask me questions while you tour the home.