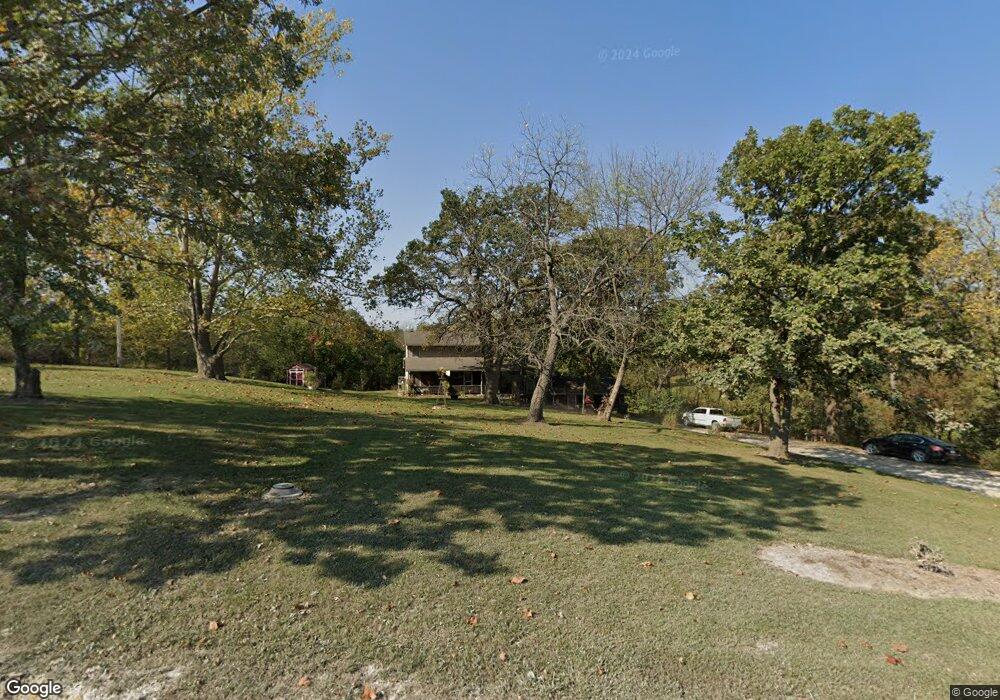
23322 S Prettyman Rd Harrisonville, MO 64701
Estimated Value: $463,000 - $562,000
4
Beds
4
Baths
2,805
Sq Ft
$181/Sq Ft
Est. Value
About This Home
This home is located at 23322 S Prettyman Rd, Harrisonville, MO 64701 and is currently estimated at $507,139, approximately $180 per square foot. 23322 S Prettyman Rd is a home located in Cass County with nearby schools including McEowen Elementary School, Harrisonville Elementary School, and Harrisonville Middle School.
Ownership History
Date
Name
Owned For
Owner Type
Purchase Details
Closed on
Apr 28, 2017
Sold by
Bastion John J and Bastion Robin M
Bought by
Bastion John J and Bastion Robin M
Current Estimated Value
Home Financials for this Owner
Home Financials are based on the most recent Mortgage that was taken out on this home.
Original Mortgage
$170,000
Outstanding Balance
$140,554
Interest Rate
3.89%
Mortgage Type
New Conventional
Estimated Equity
$366,585
Purchase Details
Closed on
Mar 25, 2010
Sold by
Fannie Mae
Bought by
Bastion John J and Bastion Cheryl A
Home Financials for this Owner
Home Financials are based on the most recent Mortgage that was taken out on this home.
Original Mortgage
$169,575
Interest Rate
4.96%
Mortgage Type
Purchase Money Mortgage
Purchase Details
Closed on
Sep 18, 2009
Sold by
Navy Fcu
Bought by
Federal National Mortgage Association
Purchase Details
Closed on
Aug 18, 2009
Sold by
Wilson Richard M and Wilson Beth J
Bought by
Navy Fcu
Create a Home Valuation Report for This Property
The Home Valuation Report is an in-depth analysis detailing your home's value as well as a comparison with similar homes in the area
Home Values in the Area
Average Home Value in this Area
Purchase History
| Date | Buyer | Sale Price | Title Company |
|---|---|---|---|
| Bastion John J | -- | None Available | |
| Bastion John J | -- | -- | |
| Federal National Mortgage Association | -- | -- | |
| Navy Fcu | $230,376 | -- |
Source: Public Records
Mortgage History
| Date | Status | Borrower | Loan Amount |
|---|---|---|---|
| Open | Bastion John J | $170,000 | |
| Closed | Bastion John J | $169,575 |
Source: Public Records
Tax History Compared to Growth
Tax History
| Year | Tax Paid | Tax Assessment Tax Assessment Total Assessment is a certain percentage of the fair market value that is determined by local assessors to be the total taxable value of land and additions on the property. | Land | Improvement |
|---|---|---|---|---|
| 2024 | $2,816 | $38,670 | $4,020 | $34,650 |
| 2023 | $2,809 | $38,670 | $4,020 | $34,650 |
| 2022 | $2,523 | $34,230 | $4,020 | $30,210 |
| 2021 | $2,420 | $34,230 | $4,020 | $30,210 |
| 2020 | $2,331 | $33,050 | $4,020 | $29,030 |
| 2019 | $2,166 | $33,050 | $4,020 | $29,030 |
| 2018 | $2,002 | $30,270 | $3,220 | $27,050 |
| 2017 | $1,815 | $30,270 | $3,220 | $27,050 |
| 2016 | $1,815 | $28,660 | $3,220 | $25,440 |
| 2015 | $1,815 | $28,660 | $3,220 | $25,440 |
| 2014 | $1,815 | $28,660 | $3,220 | $25,440 |
| 2013 | -- | $28,660 | $3,220 | $25,440 |
Source: Public Records
Map
Nearby Homes
- 23400 S Cottage Ln
- 23220 S State Route 291
- 24320 S Grabe Rd
- 0 Delmar St
- 0 Hickory St
- 207 Sycamore St
- 402 N Independence St
- 701 & 703 Cass St
- 805 Ash St
- 104 W Pearl St
- 900 N King Ave
- 1105 N Halsey Ave
- 706 S Butler Dr
- 307 N Bradley Ave
- 802 S Butler Dr
- 802 S Morgan Dr
- 24406 S Persimmon Ln
- 505 E Wall St
- 603 S Independence St
- 0 E Pine St
- 23418 S Prettyman Rd
- 23319 S Prettyman Rd
- 23302 S Prettyman Rd
- 17504 E 235th St
- 23425 S Prettyman Rd
- 23216 S Prettyman Rd
- 17506 E 235th St
- 23209 S Prettyman Rd
- 23202 S Prettyman Rd
- 23601 S Link Rd
- 23508 S Prettyman Rd
- 17607 E 231st St
- 17709 E 231st St
- 17400 E 235th St
- 17801 E 231st St
- 17705 E 231st St
- 18211 E 231st St
- 17601 E 231st St
- 18303 E 231st St
- 17109 E 235th St