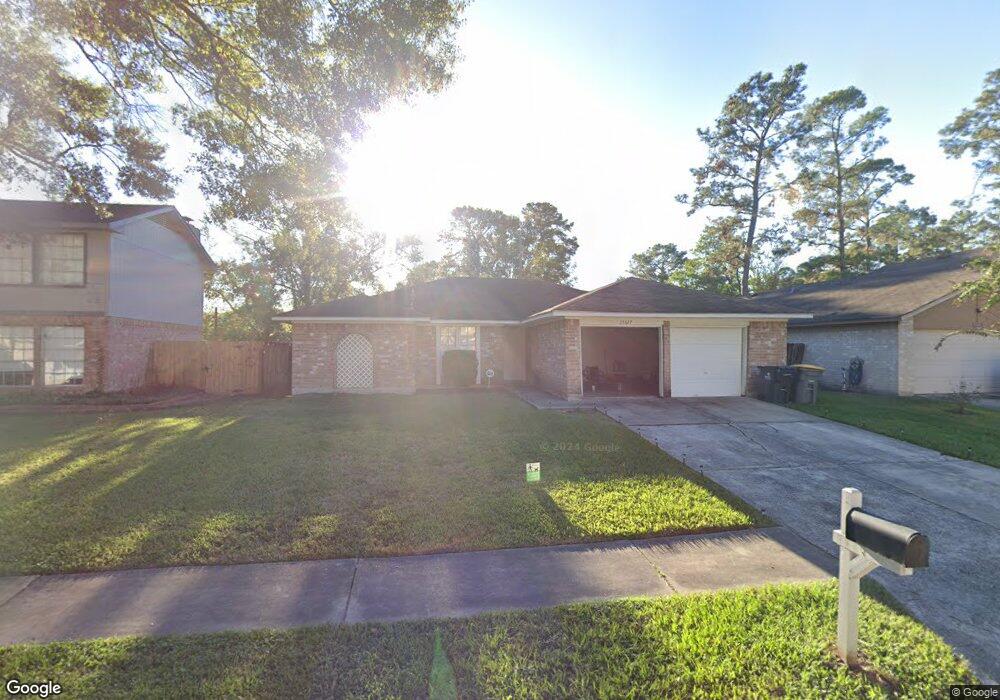
23327 Dew Wood Ln Spring, TX 77373
Estimated Value: $210,000 - $228,000
3
Beds
2
Baths
1,733
Sq Ft
$125/Sq Ft
Est. Value
About This Home
This home is located at 23327 Dew Wood Ln, Spring, TX 77373 and is currently estimated at $216,480, approximately $124 per square foot. 23327 Dew Wood Ln is a home located in Harris County with nearby schools including Chet Burchett Elementary School, Dueitt Middle School, and Spring High School.
Ownership History
Date
Name
Owned For
Owner Type
Purchase Details
Closed on
Apr 25, 2024
Sold by
Altomari Freddy
Bought by
Cali Investment Group Llc
Current Estimated Value
Purchase Details
Closed on
Mar 17, 2015
Sold by
Memphis Invest Gp
Bought by
Altomari Freddy Michael
Home Financials for this Owner
Home Financials are based on the most recent Mortgage that was taken out on this home.
Original Mortgage
$93,675
Interest Rate
3.6%
Mortgage Type
New Conventional
Purchase Details
Closed on
Oct 2, 2014
Sold by
Jones Charles K and Jones Kathryn S
Bought by
Memphis Invest Gp
Purchase Details
Closed on
Jun 11, 2002
Sold by
Jones Jonathan Kent and Rovinsky Carol J
Bought by
Jones Charles Kevin and Jones Kathryn S
Home Financials for this Owner
Home Financials are based on the most recent Mortgage that was taken out on this home.
Original Mortgage
$39,599
Interest Rate
4.1%
Create a Home Valuation Report for This Property
The Home Valuation Report is an in-depth analysis detailing your home's value as well as a comparison with similar homes in the area
Home Values in the Area
Average Home Value in this Area
Purchase History
| Date | Buyer | Sale Price | Title Company |
|---|---|---|---|
| Cali Investment Group Llc | -- | None Listed On Document | |
| Altomari Freddy Michael | -- | Providence Title Co | |
| Memphis Invest Gp | -- | None Available | |
| Jones Charles Kevin | -- | None Available |
Source: Public Records
Mortgage History
| Date | Status | Borrower | Loan Amount |
|---|---|---|---|
| Previous Owner | Altomari Freddy Michael | $93,675 | |
| Previous Owner | Jones Charles Kevin | $39,599 |
Source: Public Records
Tax History Compared to Growth
Tax History
| Year | Tax Paid | Tax Assessment Tax Assessment Total Assessment is a certain percentage of the fair market value that is determined by local assessors to be the total taxable value of land and additions on the property. | Land | Improvement |
|---|---|---|---|---|
| 2025 | $4,022 | $210,487 | $51,808 | $158,679 |
| 2024 | $4,022 | $169,523 | $51,808 | $117,715 |
| 2023 | $4,022 | $201,422 | $51,808 | $149,614 |
| 2022 | $4,652 | $189,105 | $36,392 | $152,713 |
| 2021 | $3,859 | $149,184 | $15,163 | $134,021 |
| 2020 | $3,648 | $136,209 | $15,163 | $121,046 |
| 2019 | $3,753 | $136,209 | $15,163 | $121,046 |
| 2018 | $3,850 | $127,482 | $15,163 | $112,319 |
| 2017 | $3,509 | $127,482 | $15,163 | $112,319 |
| 2016 | $2,862 | $103,959 | $15,163 | $88,796 |
| 2015 | $2,527 | $97,955 | $15,163 | $82,792 |
| 2014 | $2,527 | $88,704 | $15,163 | $73,541 |
Source: Public Records
Map
Nearby Homes
- 4307 Wyanngate Dr
- 5031 Monteith Dr
- 23338 Goodfellow Dr
- 5027 Monteith Dr
- 23206 Goodfellow Dr
- 5015 Monteith Dr
- 5311 Sweetwind Ln
- 5414 Sweetwind Ln
- 23114 Goodfellow Dr
- 5410 Dibello Forest Ln
- 5023 Glendower Dr
- 5002 Maurita Dr
- 5311 Oaklynn Dr
- 23103 Calico Corners Ln
- 5527 Broad Spruce St
- 4807 Maurita Dr
- 4819 Glendower Dr
- 23022 Laketree Ln
- 23431 Wrexham St
- 4706 Glendower Dr
- 23323 Dew Wood Ln
- 23331 Dew Wood Ln
- 23318 Goodfellow Dr
- 23319 Dew Wood Ln
- 23335 Dew Wood Ln
- 23322 Goodfellow Dr
- 23326 Dew Wood Ln
- 23322 Dew Wood Ln
- 23322 Dew Wood Ln
- 23310 Goodfellow Dr
- 23315 Dew Wood Ln
- 23403 Dew Wood Ln
- 23330 Dew Wood Ln
- 23330 Goodfellow Dr
- 23318 Dew Wood Ln
- 23306 Goodfellow Dr
- 4327 Wyanngate Dr
- 23314 Dew Wood Ln
- 23407 Dew Wood Ln
- 23334 Goodfellow Dr