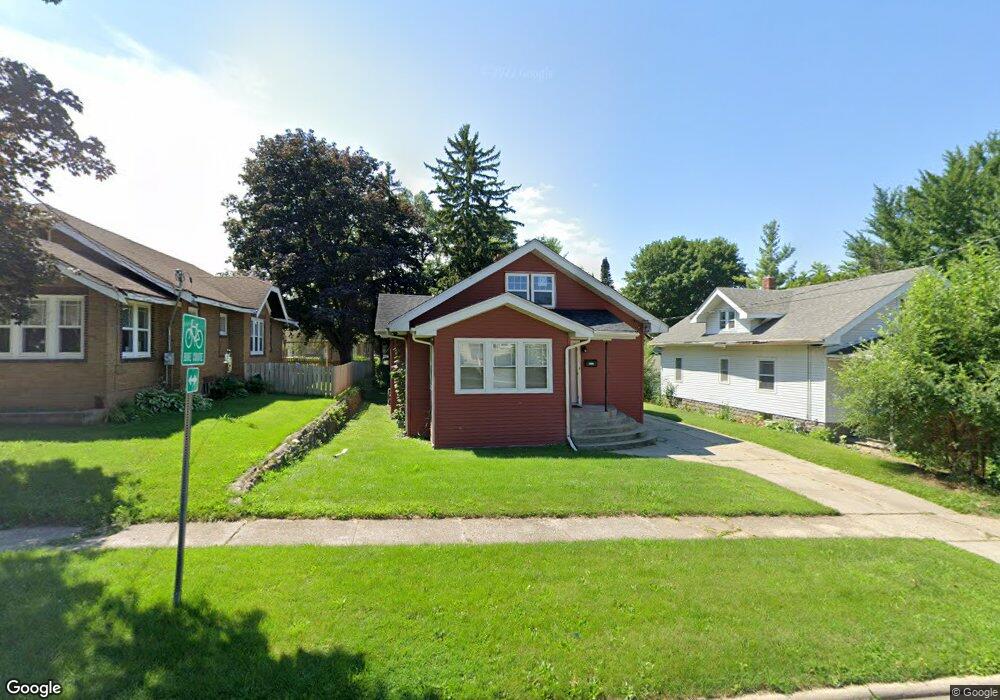
2333 17th Ave Rockford, IL 61104
Estimated Value: $94,709 - $121,000
2
Beds
1
Bath
1,068
Sq Ft
$100/Sq Ft
Est. Value
About This Home
This home is located at 2333 17th Ave, Rockford, IL 61104 and is currently estimated at $106,927, approximately $100 per square foot. 2333 17th Ave is a home located in Winnebago County with nearby schools including Whitehead Elementary School, Bernard W. Flinn Middle School, and Rockford East High School.
Ownership History
Date
Name
Owned For
Owner Type
Purchase Details
Closed on
Jun 19, 2023
Sold by
Castle Painting & Development Llc
Bought by
Castelan Jovanny
Current Estimated Value
Purchase Details
Closed on
May 1, 2020
Sold by
Bonnie Veline
Bought by
Castle Painting & Development Llc
Purchase Details
Closed on
Jun 11, 2019
Sold by
Veline Dale D
Bought by
Veline Bonnie
Create a Home Valuation Report for This Property
The Home Valuation Report is an in-depth analysis detailing your home's value as well as a comparison with similar homes in the area
Home Values in the Area
Average Home Value in this Area
Purchase History
| Date | Buyer | Sale Price | Title Company |
|---|---|---|---|
| Castelan Jovanny | $40,000 | None Listed On Document | |
| Castle Painting & Development Llc | $15,500 | Reno & Zahm Llp | |
| Castle Painting & Development Llc | $15,500 | Reno & Zahm Llp | |
| Veline Bonnie | -- | Reno & Zahm Llp |
Source: Public Records
Tax History Compared to Growth
Tax History
| Year | Tax Paid | Tax Assessment Tax Assessment Total Assessment is a certain percentage of the fair market value that is determined by local assessors to be the total taxable value of land and additions on the property. | Land | Improvement |
|---|---|---|---|---|
| 2024 | $1,823 | $25,233 | $5,005 | $20,228 |
| 2023 | $2,310 | $22,249 | $4,413 | $17,836 |
| 2022 | $1,581 | $13,836 | $3,944 | $9,892 |
| 2021 | $2,145 | $17,499 | $3,616 | $13,883 |
| 2020 | $2,183 | $16,974 | $3,418 | $13,556 |
| 2019 | $2,167 | $16,178 | $3,258 | $12,920 |
| 2018 | $774 | $16,427 | $3,071 | $13,356 |
| 2017 | $657 | $15,721 | $2,939 | $12,782 |
| 2016 | $669 | $15,426 | $2,884 | $12,542 |
| 2015 | $339 | $15,426 | $2,884 | $12,542 |
| 2014 | $1,226 | $16,672 | $3,613 | $13,059 |
Source: Public Records
Map
Nearby Homes