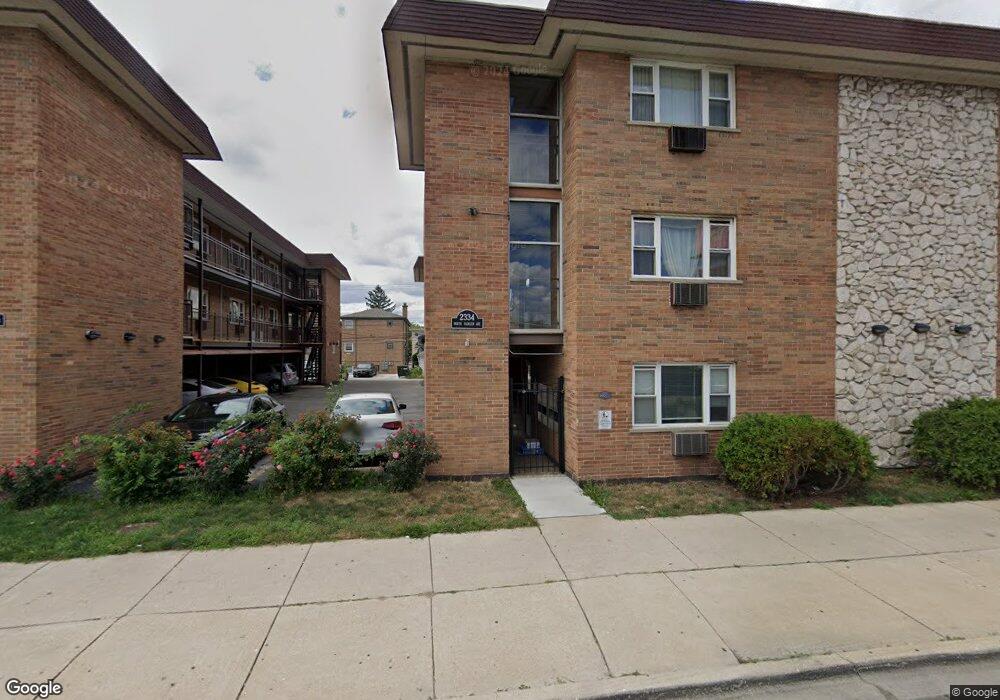
2334 N Harlem Ave Unit 23342C Elmwood Park, IL 60707
Estimated Value: $123,000 - $144,000
1
Bed
--
Bath
700
Sq Ft
$192/Sq Ft
Est. Value
About This Home
This home is located at 2334 N Harlem Ave Unit 23342C, Elmwood Park, IL 60707 and is currently estimated at $134,309, approximately $191 per square foot. 2334 N Harlem Ave Unit 23342C is a home located in Cook County with nearby schools including Elmwood Elementary School, John Mills Elementary School, and Elm Middle School.
Ownership History
Date
Name
Owned For
Owner Type
Purchase Details
Closed on
Apr 12, 2019
Sold by
Bakopoulos Stavros J
Bought by
Bakopoulos Stavros J and Bakopoulos Christ S
Current Estimated Value
Purchase Details
Closed on
Dec 6, 2017
Sold by
Bakaj Robin
Bought by
Bakopoulos Stavros J
Purchase Details
Closed on
Sep 10, 2004
Sold by
Doliwa Urszula
Bought by
Bakaj Bob
Home Financials for this Owner
Home Financials are based on the most recent Mortgage that was taken out on this home.
Original Mortgage
$92,400
Interest Rate
4.5%
Mortgage Type
Credit Line Revolving
Purchase Details
Closed on
Jan 23, 2003
Sold by
Loulee Inc
Bought by
Doliwa Urszula
Home Financials for this Owner
Home Financials are based on the most recent Mortgage that was taken out on this home.
Original Mortgage
$88,350
Interest Rate
6.13%
Create a Home Valuation Report for This Property
The Home Valuation Report is an in-depth analysis detailing your home's value as well as a comparison with similar homes in the area
Home Values in the Area
Average Home Value in this Area
Purchase History
| Date | Buyer | Sale Price | Title Company |
|---|---|---|---|
| Bakopoulos Stavros J | -- | Accommodation | |
| Bakopoulos Stavros J | $70,000 | Proper Title Llc | |
| Bakaj Bob | $115,500 | Stewart Title Of Illinois | |
| Doliwa Urszula | $93,000 | -- |
Source: Public Records
Mortgage History
| Date | Status | Borrower | Loan Amount |
|---|---|---|---|
| Previous Owner | Bakaj Bob | $92,400 | |
| Previous Owner | Doliwa Urszula | $88,350 |
Source: Public Records
Tax History Compared to Growth
Tax History
| Year | Tax Paid | Tax Assessment Tax Assessment Total Assessment is a certain percentage of the fair market value that is determined by local assessors to be the total taxable value of land and additions on the property. | Land | Improvement |
|---|---|---|---|---|
| 2024 | $1,802 | $9,272 | $673 | $8,599 |
| 2023 | $1,718 | $9,272 | $673 | $8,599 |
| 2022 | $1,718 | $9,272 | $673 | $8,599 |
| 2021 | $2,296 | $6,112 | $448 | $5,664 |
| 2020 | $2,218 | $6,112 | $448 | $5,664 |
| 2019 | $1,997 | $6,849 | $448 | $6,401 |
| 2018 | $1,474 | $4,541 | $386 | $4,155 |
| 2017 | $366 | $4,541 | $386 | $4,155 |
| 2016 | $579 | $4,541 | $386 | $4,155 |
| 2015 | $336 | $3,705 | $348 | $3,357 |
| 2014 | $265 | $3,584 | $348 | $3,236 |
| 2013 | $417 | $4,794 | $348 | $4,446 |
Source: Public Records
Map
Nearby Homes
- 2334 N Harlem Ave Unit 3C
- 7230 W Belden Ave Unit 1
- 7150 W Grand Ave
- 2318 N 73rd Ave
- 2222 N Harlem Ave Unit 2NW
- 2234 N Neva Ave
- 2325 N Neva Ave Unit 404B
- 2233 N 73rd Ct
- 2513 N 72nd Ct
- 2221 N 73rd Ct
- 2510 N 72nd Ct
- 2530 N Neva Ave
- 2224 N Nordica Ave
- 2525 N 72nd Ct Unit 2AN
- 7036 W Belden Ave
- 2524 N Mont Clare Ave
- 2530 N 72nd Ct Unit 2W
- 2546 N Harlem Ave Unit GC
- 2541 N Mont Clare Ave
- 2142 N 73rd Ct
- 2334 N Harlem Ave Unit 3G
- 2334 N Harlem Ave Unit 2G
- 2330 N Harlem Ave Unit 3A
- 2330 N Harlem Ave Unit 23302G
- 2330 N Harlem Ave Unit 23301E
- 2330 N Harlem Ave Unit 23301D
- 2330 N Harlem Ave Unit 23301B
- 2334 N Harlem Ave Unit 23341E
- 2334 N Harlem Ave Unit 23343B
- 2330 N Harlem Ave Unit 23302F
- 2334 N Harlem Ave Unit 23342B
- 2330 N Harlem Ave Unit 23301C
- 2334 N Harlem Ave Unit 23342F
- 2334 N Harlem Ave Unit 23343F
- 2334 N Harlem Ave Unit 23342D
- 2334 N Harlem Ave Unit 23341A
- 2330 N Harlem Ave Unit 23303E
- 2334 N Harlem Ave Unit 23303F
- 2334 N Harlem Ave Unit 23343D
- 2330 N Harlem Ave Unit 23303G