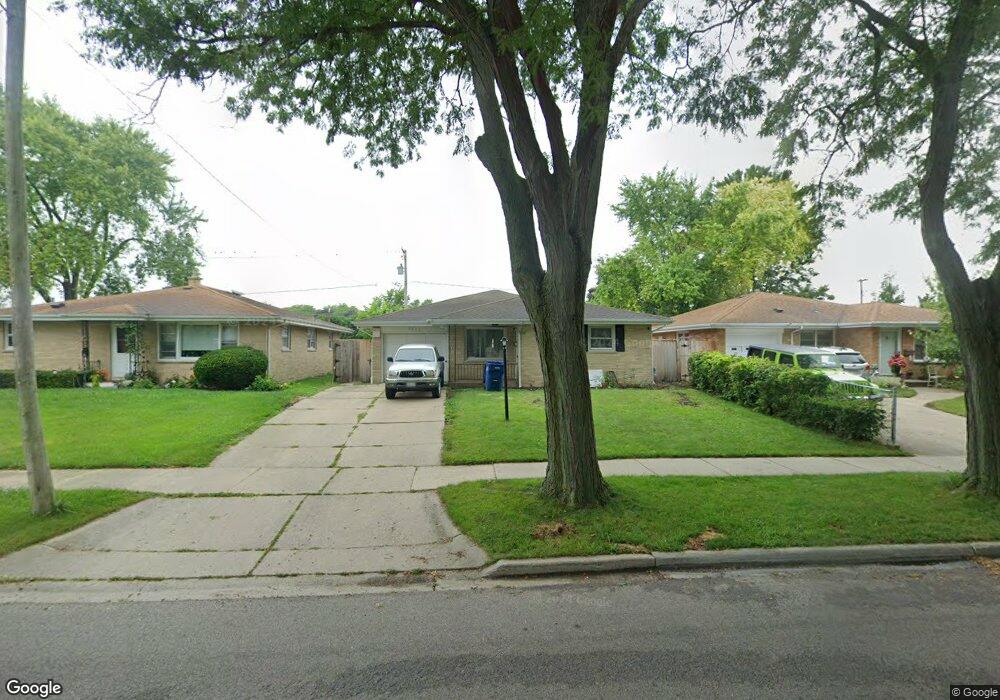
2334 N Jackson St Waukegan, IL 60087
Marquette Highlands NeighborhoodEstimated Value: $232,000 - $260,000
3
Beds
2
Baths
1,250
Sq Ft
$195/Sq Ft
Est. Value
About This Home
This home is located at 2334 N Jackson St, Waukegan, IL 60087 and is currently estimated at $244,328, approximately $195 per square foot. 2334 N Jackson St is a home located in Lake County with nearby schools including John S. Clark Elementary School, Jack Benny Middle School, and Waukegan High School.
Ownership History
Date
Name
Owned For
Owner Type
Purchase Details
Closed on
Dec 27, 2023
Sold by
Bahena Romelia
Bought by
Romelia Bahena Revocable Trust
Current Estimated Value
Purchase Details
Closed on
Dec 13, 2017
Sold by
Alexandrov Lyubomir
Bought by
Alexandrov Lyubomir and 2334 Jackson St Land Trust
Purchase Details
Closed on
Dec 8, 2017
Sold by
Alexandrov Lyubomir and Jackson St Land Trust
Bought by
Bahena Romella and Bahena Ruperto
Purchase Details
Closed on
Apr 13, 2012
Sold by
Helander Willard
Bought by
Alexandrov Lyubomir
Purchase Details
Closed on
May 1, 2007
Sold by
Bockeloh Mae A
Bought by
Bockeloh Mae A and Mae A Bockeloh Trust #1
Purchase Details
Closed on
Oct 16, 1998
Sold by
Bockeloh Michael
Bought by
Bockeloh Wiliam and Bockeloh Mae A
Purchase Details
Closed on
Aug 26, 1995
Sold by
Bockeloh Michael W
Bought by
First Midwest Trust Company
Create a Home Valuation Report for This Property
The Home Valuation Report is an in-depth analysis detailing your home's value as well as a comparison with similar homes in the area
Home Values in the Area
Average Home Value in this Area
Purchase History
| Date | Buyer | Sale Price | Title Company |
|---|---|---|---|
| Romelia Bahena Revocable Trust | -- | None Listed On Document | |
| Alexandrov Lyubomir | -- | Security First Title Co | |
| Bahena Romella | $115,000 | Security First Title Co | |
| Alexandrov Lyubomir | -- | None Available | |
| Bockeloh Mae A | -- | None Available | |
| Bockeloh Wiliam | -- | -- | |
| First Midwest Trust Company | -- | -- |
Source: Public Records
Tax History Compared to Growth
Tax History
| Year | Tax Paid | Tax Assessment Tax Assessment Total Assessment is a certain percentage of the fair market value that is determined by local assessors to be the total taxable value of land and additions on the property. | Land | Improvement |
|---|---|---|---|---|
| 2024 | $5,517 | $64,835 | $10,657 | $54,178 |
| 2023 | $5,276 | $58,504 | $9,616 | $48,888 |
| 2022 | $5,276 | $53,970 | $8,323 | $45,647 |
| 2021 | $5,049 | $48,431 | $7,425 | $41,006 |
| 2020 | $5,115 | $45,119 | $6,917 | $38,202 |
| 2019 | $5,147 | $41,344 | $6,338 | $35,006 |
| 2018 | $4,828 | $37,342 | $8,970 | $28,372 |
| 2017 | $4,699 | $33,037 | $7,936 | $25,101 |
| 2016 | $4,436 | $28,708 | $6,896 | $21,812 |
| 2015 | $4,340 | $25,694 | $6,172 | $19,522 |
| 2014 | $2,663 | $23,156 | $6,389 | $16,767 |
| 2012 | $5,263 | $27,190 | $6,922 | $20,268 |
Source: Public Records
Map
Nearby Homes
- 2232 Walnut St
- 301 W Eagle Ct
- 1905 Linden Ave
- 0 Traditions Dr
- 1612 Whitney St
- 2350 N Lewis Ave
- 2613 N Lewis Ave
- 2246 Alta Vista Dr
- 616 W Keith Ave
- 2213 Alta Vista Dr
- 1018 W Atlantic Ave
- 1636 Rice St
- 37231 N Ganster Rd
- 1336 N Ash St
- 1335 Chestnut St
- 1312 N Linden Ave
- 2207 Williamsburg Dr
- 10241 W Bairstow Ave
- 1913 Chippewa Rd
- 2008 Harding Ave
- 2330 N Jackson St
- 2338 N Jackson St
- 2326 N Jackson St
- 2342 N Jackson St
- 2333 Walnut St
- 2337 Walnut St
- 2329 Walnut St
- 901 Montesano Ave
- 2322 N Jackson St
- 2345 Walnut St
- 2337 N Jackson St
- 2329 N Jackson St
- 2318 N Jackson St
- 2325 N Jackson St
- 815 Montesano Ave
- 2321 Walnut St
- 2314 N Jackson St
- 2319 N Jackson St
- 2402 N Jackson St