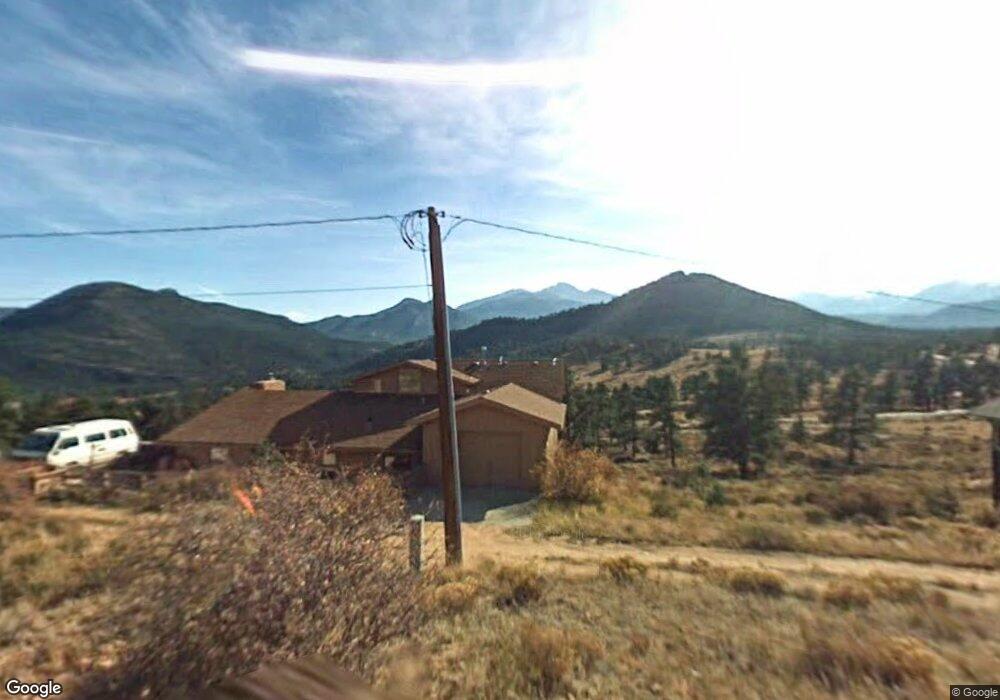
2334 Upper High Dr Estes Park, CO 80517
Estimated Value: $506,384 - $715,000
2
Beds
1
Bath
1,260
Sq Ft
$472/Sq Ft
Est. Value
About This Home
This home is located at 2334 Upper High Dr, Estes Park, CO 80517 and is currently estimated at $594,346, approximately $471 per square foot. 2334 Upper High Dr is a home located in Larimer County with nearby schools including Estes Park K-5 School, Estes Park Middle School, and Estes Park High School.
Ownership History
Date
Name
Owned For
Owner Type
Purchase Details
Closed on
Feb 9, 2024
Sold by
Northrop John M
Bought by
Stringer Renae D and Lee Amy
Current Estimated Value
Home Financials for this Owner
Home Financials are based on the most recent Mortgage that was taken out on this home.
Original Mortgage
$61,675
Outstanding Balance
$55,987
Interest Rate
5.87%
Mortgage Type
New Conventional
Estimated Equity
$538,359
Purchase Details
Closed on
Sep 7, 2023
Sold by
Stringer Renae D
Bought by
Northrop John M
Purchase Details
Closed on
Feb 3, 2022
Sold by
Northrop John M
Bought by
Stringer Renae D and Teammates Foundation
Purchase Details
Closed on
Jul 1, 1995
Sold by
Larsen Cristi L
Bought by
Northrop Michele
Purchase Details
Closed on
Sep 1, 1992
Sold by
Larsen Edith J
Bought by
Larsen Cristi L
Create a Home Valuation Report for This Property
The Home Valuation Report is an in-depth analysis detailing your home's value as well as a comparison with similar homes in the area
Home Values in the Area
Average Home Value in this Area
Purchase History
| Date | Buyer | Sale Price | Title Company |
|---|---|---|---|
| Stringer Renae D | -- | None Listed On Document | |
| Northrop John M | -- | None Listed On Document | |
| Stringer Renae D | -- | None Listed On Document | |
| Northrop Michele | $250,000 | -- | |
| Larsen Cristi L | -- | -- |
Source: Public Records
Mortgage History
| Date | Status | Borrower | Loan Amount |
|---|---|---|---|
| Open | Stringer Renae D | $61,675 |
Source: Public Records
Tax History
| Year | Tax Paid | Tax Assessment Tax Assessment Total Assessment is a certain percentage of the fair market value that is determined by local assessors to be the total taxable value of land and additions on the property. | Land | Improvement |
|---|---|---|---|---|
| 2025 | $2,869 | $33,600 | $26,250 | $7,350 |
| 2024 | $2,593 | $40,401 | $28,140 | $12,261 |
| 2022 | $2,331 | $31,276 | $13,831 | $17,445 |
| 2021 | $2,932 | $39,418 | $14,229 | $25,189 |
| 2020 | $2,300 | $30,460 | $14,229 | $16,231 |
| 2019 | $2,283 | $30,460 | $14,229 | $16,231 |
| 2018 | $2,247 | $29,052 | $13,320 | $15,732 |
| 2017 | $136 | $29,052 | $13,320 | $15,732 |
| 2016 | $2,123 | $28,274 | $14,726 | $13,548 |
| 2015 | $2,096 | $28,280 | $14,730 | $13,550 |
| 2014 | $1,861 | $25,790 | $17,910 | $7,880 |
Source: Public Records
Map
Nearby Homes
- 2280 Valerian Ln
- 1945 Tanager Rd
- 710 Tanager Rd
- 725 Upper Larkspur Ln
- 1631 High Dr
- 55 Odin Way
- 56 Odin Way
- 1611 High Dr
- 810 Larkspur Rd
- 27 Freyja Ln
- 24 Ln
- 1565 Highway 66 Unit 31
- 1565 Highway 66 Unit 33
- 1565 Highway 66 Unit 27
- 1565 Highway 66 Unit 49
- 1565 Highway 66 Unit 30
- 2242 Eagle Cliff Rd
- 1401 High Dr
- 1475 Lower Broadview Rd
- 0 High Dr Unit IRE1053780
- 2330 Upper High Dr
- 2300 Upper High Dr
- 2371 High Dr
- 2340 Upper High Dr
- 2260 Penstemon Dr
- 2301 High Dr
- 2331 Penstemon Dr
- 2291 Valerian Ln
- 2050 Upper Upper High Dr
- 2341 Penstemon Dr
- 2230 Upper High Dr
- 2280 Valerian Ln
- 2251 Upper High Dr
- 2261 High Dr
- 2200 Penstemon Dr
- 2221 High Dr
- 2211 High Dr
- 2201 High Dr
- 2160 Upper High Dr
- 2190 Gaillardia Dr
Your Personal Tour Guide
Ask me questions while you tour the home.