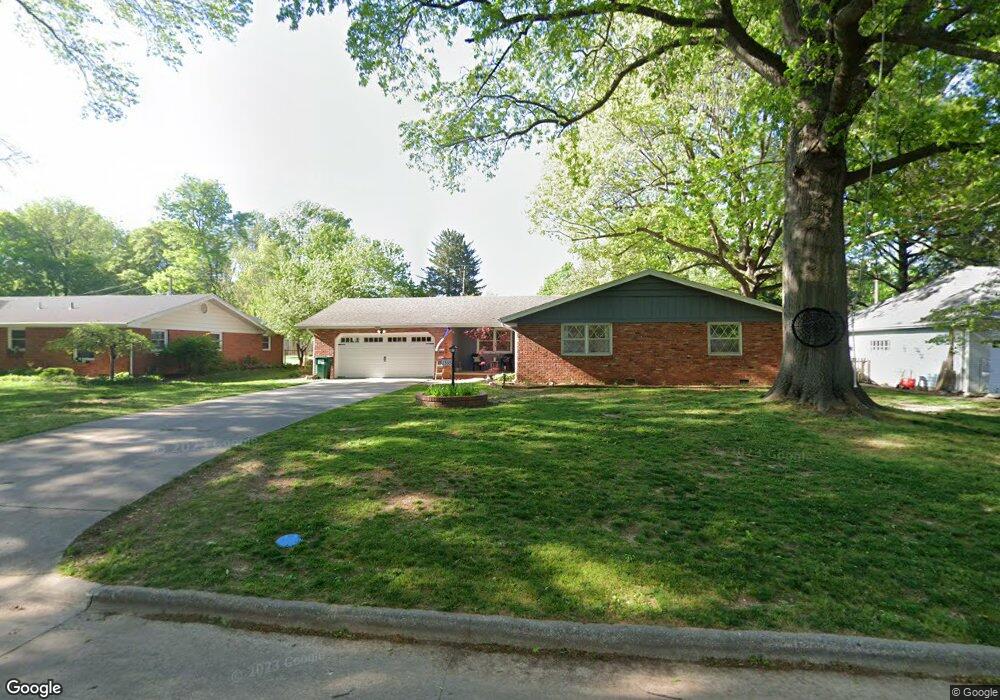
2335 E Wayland St Springfield, MO 65804
Brentwood NeighborhoodEstimated Value: $269,000 - $300,000
3
Beds
2
Baths
1,802
Sq Ft
$160/Sq Ft
Est. Value
About This Home
This home is located at 2335 E Wayland St, Springfield, MO 65804 and is currently estimated at $289,218, approximately $160 per square foot. 2335 E Wayland St is a home located in Greene County with nearby schools including Glendale High School, Discovery Garden Montessori School, and Grace Classical Academy.
Ownership History
Date
Name
Owned For
Owner Type
Purchase Details
Closed on
Aug 10, 2020
Sold by
Coryell Laura Eliiiisabeth and Coryell Daniel Warren
Bought by
Humphrey Natalie Joann and Humphrey Joseph Bendamin
Current Estimated Value
Home Financials for this Owner
Home Financials are based on the most recent Mortgage that was taken out on this home.
Original Mortgage
$121,250
Outstanding Balance
$107,756
Interest Rate
3.1%
Mortgage Type
New Conventional
Estimated Equity
$181,462
Purchase Details
Closed on
Jul 15, 2015
Sold by
Garside Andrew
Bought by
Humphrey Laura and Garside Laura
Purchase Details
Closed on
Apr 7, 2014
Sold by
Frieze Thora A
Bought by
Garside Andrew and Garside Laura
Home Financials for this Owner
Home Financials are based on the most recent Mortgage that was taken out on this home.
Original Mortgage
$127,153
Interest Rate
4.4%
Mortgage Type
FHA
Create a Home Valuation Report for This Property
The Home Valuation Report is an in-depth analysis detailing your home's value as well as a comparison with similar homes in the area
Home Values in the Area
Average Home Value in this Area
Purchase History
| Date | Buyer | Sale Price | Title Company |
|---|---|---|---|
| Humphrey Natalie Joann | -- | None Available | |
| Humphrey Laura | -- | None Available | |
| Garside Andrew | -- | Choice Escrow & Land Title L |
Source: Public Records
Mortgage History
| Date | Status | Borrower | Loan Amount |
|---|---|---|---|
| Open | Humphrey Natalie Joann | $121,250 | |
| Previous Owner | Garside Andrew | $127,153 |
Source: Public Records
Tax History
| Year | Tax Paid | Tax Assessment Tax Assessment Total Assessment is a certain percentage of the fair market value that is determined by local assessors to be the total taxable value of land and additions on the property. | Land | Improvement |
|---|---|---|---|---|
| 2025 | $2,294 | $46,040 | $9,460 | $36,580 |
| 2024 | $1,602 | $29,850 | $4,450 | $25,400 |
| 2023 | $1,592 | $29,850 | $4,450 | $25,400 |
| 2022 | $1,453 | $26,600 | $4,450 | $22,150 |
| 2021 | $1,453 | $26,600 | $4,450 | $22,150 |
| 2020 | $1,373 | $24,040 | $4,450 | $19,590 |
| 2019 | $1,334 | $24,040 | $4,450 | $19,590 |
| 2018 | $1,245 | $22,440 | $4,450 | $17,990 |
| 2017 | $1,232 | $20,810 | $4,450 | $16,360 |
| 2016 | $1,140 | $20,810 | $4,450 | $16,360 |
| 2015 | $1,130 | $20,810 | $4,450 | $16,360 |
| 2014 | $1,122 | $20,520 | $4,450 | $16,070 |
Source: Public Records
Map
Nearby Homes
- 2101 S Glendale Ave
- 2166 S Valleyroad Ave
- 2308 E Latoka St
- 1942 S Luster Ave
- 2541 S Luster Ave
- 2532 S Brentwood Blvd
- 2435 S Brentwood Blvd
- 2656 E Southern Hills Blvd
- 4615 S Luster Ave
- 1845 S Link Ave
- 2723 E Glenwood St
- 2404 S Cedarbrook Ave
- 2652 S Luster Ave
- 1911 S Saratoga Ave
- 2860 E Southern Hills Blvd
- 2312 E Barataria St
- 1702 S Oak Grove Ave
- 1609 E Cherokee St
- 2801 S Lone Pine Ave
- 2850 S Barnes Ave
- 2347 E Wayland St
- 2325 E Wayland St
- 2334 E Seminole St
- 2340 E Seminole St
- 2326 E Seminole St
- 2359 E Wayland St
- 2344 E Wayland St
- 2313 E Wayland St
- 2332 E Wayland St
- 2356 E Wayland St
- 2348 E Seminole St
- 2322 E Wayland St
- 2312 E Seminole St
- 2369 E Wayland St
- 2303 E Wayland St
- 2358 E Seminole St
- 2335 E Berkeley St
- 2306 E Wayland St
- 2337 E Berkeley St
- 2302 E Seminole St
Your Personal Tour Guide
Ask me questions while you tour the home.