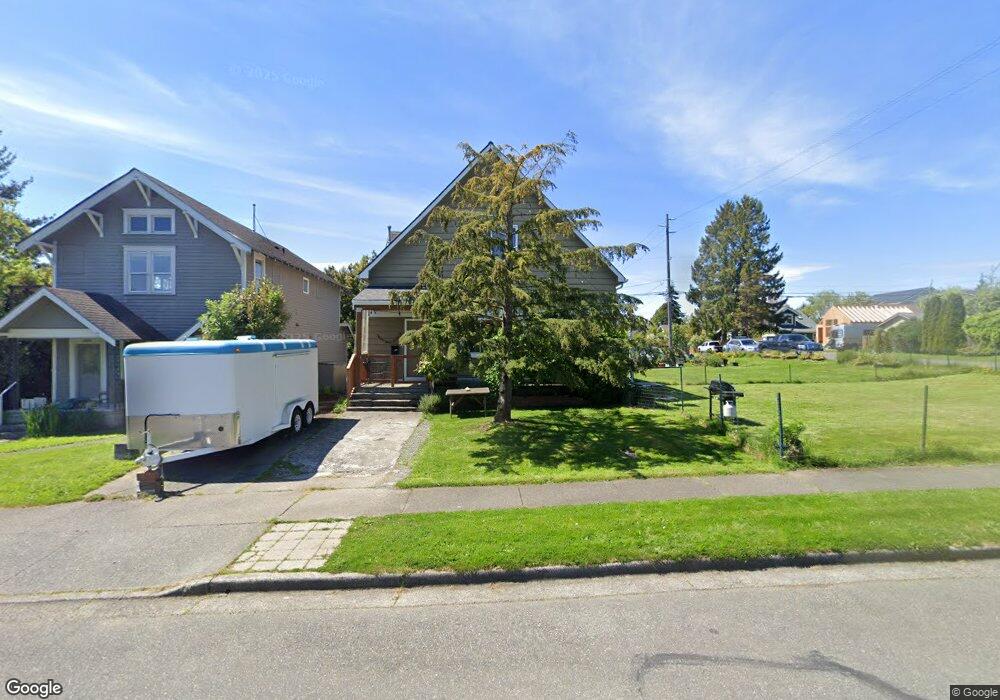
2335 Grant St Bellingham, WA 98225
Sunnyland NeighborhoodEstimated Value: $766,470 - $886,000
3
Beds
3
Baths
3,183
Sq Ft
$257/Sq Ft
Est. Value
About This Home
This home is located at 2335 Grant St, Bellingham, WA 98225 and is currently estimated at $819,368, approximately $257 per square foot. 2335 Grant St is a home located in Whatcom County with nearby schools including Sunnyland Elementary School, Whatcom Middle School, and Bellingham High School.
Ownership History
Date
Name
Owned For
Owner Type
Purchase Details
Closed on
Oct 10, 2007
Sold by
Point Cagney C and Point Irene
Bought by
Point Cagney C and Point Irene
Current Estimated Value
Create a Home Valuation Report for This Property
The Home Valuation Report is an in-depth analysis detailing your home's value as well as a comparison with similar homes in the area
Home Values in the Area
Average Home Value in this Area
Purchase History
| Date | Buyer | Sale Price | Title Company |
|---|---|---|---|
| Point Cagney C | -- | First American |
Source: Public Records
Tax History Compared to Growth
Tax History
| Year | Tax Paid | Tax Assessment Tax Assessment Total Assessment is a certain percentage of the fair market value that is determined by local assessors to be the total taxable value of land and additions on the property. | Land | Improvement |
|---|---|---|---|---|
| 2024 | $6,194 | $776,339 | $277,092 | $499,247 |
| 2023 | $6,194 | $796,058 | $284,130 | $511,928 |
| 2022 | $5,059 | $686,269 | $244,944 | $441,325 |
| 2021 | $4,963 | $544,658 | $194,400 | $350,258 |
| 2020 | $5,071 | $504,313 | $180,000 | $324,313 |
| 2019 | $4,540 | $498,040 | $199,644 | $298,396 |
| 2018 | $4,572 | $447,063 | $179,244 | $267,819 |
| 2017 | $3,943 | $384,907 | $154,320 | $230,587 |
| 2016 | $3,451 | $346,943 | $138,480 | $208,463 |
| 2015 | $3,383 | $316,058 | $126,480 | $189,578 |
| 2014 | -- | $299,865 | $120,000 | $179,865 |
| 2013 | -- | $298,853 | $113,400 | $185,453 |
Source: Public Records
Map
Nearby Homes
- 2327 Grant St
- 2401 Grant St
- 2323 Grant St
- 2336 Franklin St
- 2332 Franklin St
- 2328 Franklin St
- 2326 Franklin St
- 2409 Grant St
- 2317 Grant St
- 2320 Franklin St
- 2336 Grant St
- 2334 Grant St
- 2315 Grant St
- 2330 Grant St
- 2400 Franklin St
- 2411 Grant St
- 2324 Grant St
- 2318 Franklin St
- 2400 Grant St
- 2320 Grant St