Estimated Value: $449,000 - $673,832
4
Beds
3
Baths
3,021
Sq Ft
$186/Sq Ft
Est. Value
About This Home
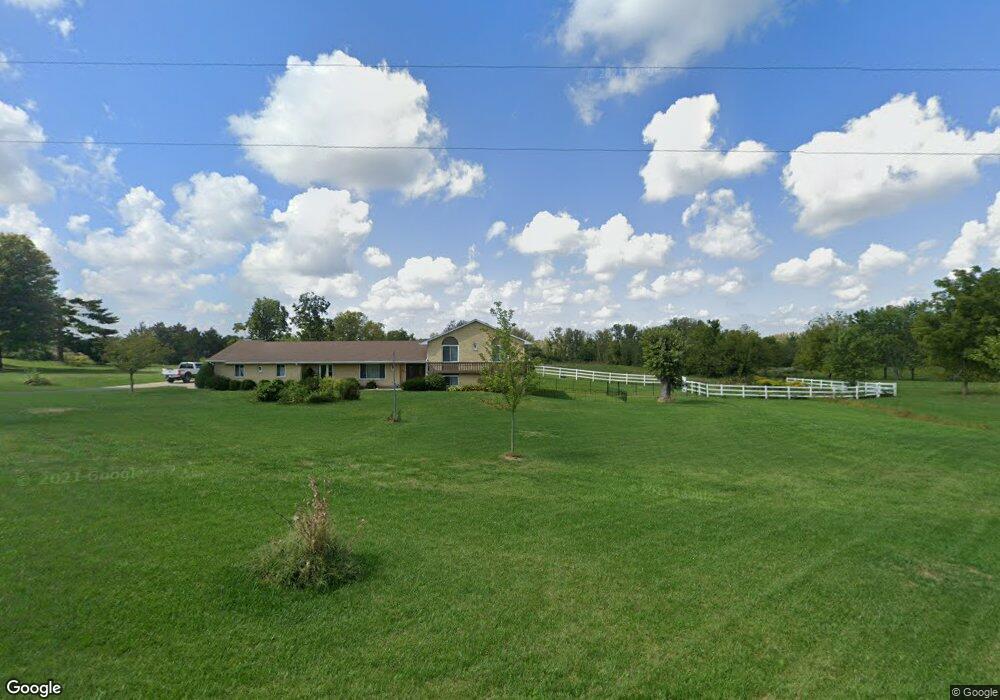
This home is located at 2335 Linebaugh Rd, Xenia, OH 45385 and is currently estimated at $561,416, approximately $185 per square foot. 2335 Linebaugh Rd is a home located in Greene County with nearby schools including Trebein Elementary School, Jacob Coy Middle School, and Beavercreek High School.
Ownership History
Date
Name
Owned For
Owner Type
Purchase Details
Closed on
Jun 14, 2021
Sold by
Baird Dana K and Haines Jeffrey P
Bought by
Harston Thomas Jeffrey Wayne and Wade Sarah E
Current Estimated Value
Home Financials for this Owner
Home Financials are based on the most recent Mortgage that was taken out on this home.
Original Mortgage
$283,920
Outstanding Balance
$254,238
Interest Rate
2.9%
Mortgage Type
VA
Estimated Equity
$307,178
Purchase Details
Closed on
Sep 25, 2019
Sold by
Haines Wretha M
Bought by
Baird Dana K and Haines Jeffrey P
Purchase Details
Closed on
Dec 18, 2017
Sold by
Haines Wretha M
Bought by
Boyd Twila D and Haines Jeffrey P
Purchase Details
Closed on
Dec 7, 2017
Sold by
Haines Wretha M and Haines Paul Ernest
Bought by
Haines Wretha M
Purchase Details
Closed on
Nov 6, 2002
Sold by
Haines Paul Ernest and Haines Wretha M
Bought by
Haines Paul Ernest and Haines Wretha M
Create a Home Valuation Report for This Property
The Home Valuation Report is an in-depth analysis detailing your home's value as well as a comparison with similar homes in the area
Purchase History
| Date | Buyer | Sale Price | Title Company |
|---|---|---|---|
| Harston Thomas Jeffrey Wayne | $480,000 | None Available | |
| Baird Dana K | -- | None Available | |
| Boyd Twila D | -- | -- | |
| Haines Wretha M | -- | -- | |
| Haines Paul Ernest | -- | -- |
Source: Public Records
Mortgage History
| Date | Status | Borrower | Loan Amount |
|---|---|---|---|
| Open | Harston Thomas Jeffrey Wayne | $283,920 |
Source: Public Records
Tax History
| Year | Tax Paid | Tax Assessment Tax Assessment Total Assessment is a certain percentage of the fair market value that is determined by local assessors to be the total taxable value of land and additions on the property. | Land | Improvement |
|---|---|---|---|---|
| 2025 | $7,619 | $131,200 | $28,580 | $102,620 |
| 2024 | $7,619 | $150,010 | $47,390 | $102,620 |
| 2023 | $7,535 | $150,010 | $47,390 | $102,620 |
| 2022 | $6,174 | $111,250 | $39,490 | $71,760 |
| 2021 | $5,533 | $108,850 | $37,360 | $71,490 |
| 2020 | $5,559 | $108,850 | $37,360 | $71,490 |
| 2019 | $5,733 | $103,010 | $37,360 | $65,650 |
| 2018 | $4,999 | $103,010 | $37,360 | $65,650 |
| 2017 | $4,905 | $103,010 | $37,360 | $65,650 |
| 2016 | $4,772 | $97,060 | $37,360 | $59,700 |
| 2015 | $4,802 | $97,060 | $37,360 | $59,700 |
| 2014 | $4,690 | $97,060 | $37,360 | $59,700 |
Source: Public Records
Map
Nearby Homes
- 2644 Ohio 235
- 1778 Ash Meadow Ct
- 1462 Champions Way
- 1482 Runnymeade Way
- 1840 Spring Ridge Ct
- 1200 Whitetail Dr
- 1475 Runnymeade Way
- 1445 Runnymeade Way
- 1193 Whitetail Dr
- 1413 Runnymeade Way
- 1788 Fawnwood Ct
- 1121 Whitetail Dr
- 1105 Windsong Trail
- 2447 Hawes Dr
- 1897 Schmidt Dr W
- 2166 Owen Cir
- 2448 Sutton Rd
- 2108 William Tanner Rd
- 2131 Schmidt Dr W
- 2450 Beaver Valley Rd
- 2313 Linebaugh Rd
- 2355 Linebaugh Rd
- 2289 Linebaugh Rd
- 2288 Linebaugh Rd
- 2373 Linebaugh Rd
- 2274 Linebaugh Rd
- 1020 Ludlow Rd
- 2409 Linebaugh Rd
- 2260 Linebaugh Rd
- 964 Ludlow Rd
- 0 Ludlow Rd
- 950 Ludlow Rd
- 00 Ludlow Rd
- 934 Ludlow Rd
- 1128 Ludlow Rd
- 1110 Ludlow Rd
- 985 Ludlow Rd
- 928 Ludlow Rd
- 922 Ludlow Rd
- Ludlow Rd Ludlow Rd
Your Personal Tour Guide
Ask me questions while you tour the home.