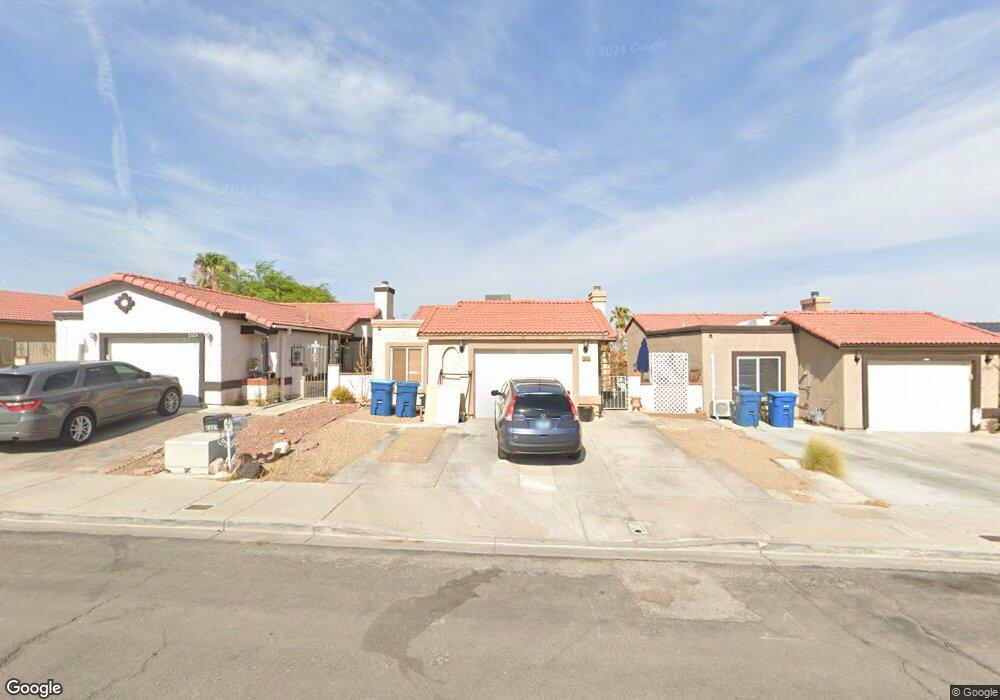
2335 Los Feliz St Las Vegas, NV 89156
Estimated Value: $297,675 - $322,000
2
Beds
2
Baths
949
Sq Ft
$325/Sq Ft
Est. Value
About This Home
This home is located at 2335 Los Feliz St, Las Vegas, NV 89156 and is currently estimated at $308,669, approximately $325 per square foot. 2335 Los Feliz St is a home located in Clark County with nearby schools including Liliam Lujan Hickey Elementary School, Dr. William H. Bailey Middle School, and Sunrise Mountain High School.
Ownership History
Date
Name
Owned For
Owner Type
Purchase Details
Closed on
May 23, 2016
Sold by
Cmg Investments Inc
Bought by
Pietrafeso Luella M
Current Estimated Value
Home Financials for this Owner
Home Financials are based on the most recent Mortgage that was taken out on this home.
Original Mortgage
$108,872
Outstanding Balance
$87,945
Interest Rate
4.12%
Mortgage Type
FHA
Estimated Equity
$220,724
Purchase Details
Closed on
Dec 11, 2015
Sold by
Smith Gabriela
Bought by
Komar Martin
Purchase Details
Closed on
Dec 9, 2015
Sold by
Komar Martin
Bought by
Cmg Investments Inc
Purchase Details
Closed on
Oct 18, 2011
Sold by
Baranova Gabriela
Bought by
Komar Martin
Purchase Details
Closed on
Oct 14, 2011
Sold by
Navy Federal Credit Union
Bought by
Komar Martin
Purchase Details
Closed on
Apr 19, 2011
Sold by
Ashcraft Fred S
Bought by
Navy Federal Credit Union
Create a Home Valuation Report for This Property
The Home Valuation Report is an in-depth analysis detailing your home's value as well as a comparison with similar homes in the area
Home Values in the Area
Average Home Value in this Area
Purchase History
| Date | Buyer | Sale Price | Title Company |
|---|---|---|---|
| Pietrafeso Luella M | $127,000 | National Title Co | |
| Komar Martin | -- | Chicago Title Of Nevada | |
| Cmg Investments Inc | $70,000 | Chicago Title Of Nevada | |
| Komar Martin | -- | Noble Title | |
| Komar Martin | $33,000 | Noble Title | |
| Navy Federal Credit Union | $46,000 | Servicelink |
Source: Public Records
Mortgage History
| Date | Status | Borrower | Loan Amount |
|---|---|---|---|
| Open | Pietrafeso Luella M | $108,872 |
Source: Public Records
Tax History Compared to Growth
Tax History
| Year | Tax Paid | Tax Assessment Tax Assessment Total Assessment is a certain percentage of the fair market value that is determined by local assessors to be the total taxable value of land and additions on the property. | Land | Improvement |
|---|---|---|---|---|
| 2025 | $730 | $48,592 | $23,450 | $25,142 |
| 2024 | $683 | $48,592 | $23,450 | $25,142 |
| 2023 | $450 | $49,325 | $24,850 | $24,475 |
| 2022 | $633 | $42,610 | $19,950 | $22,660 |
| 2021 | $581 | $38,608 | $16,800 | $21,808 |
| 2020 | $536 | $37,639 | $15,750 | $21,889 |
| 2019 | $503 | $35,862 | $14,000 | $21,862 |
| 2018 | $480 | $33,139 | $11,900 | $21,239 |
| 2017 | $954 | $32,536 | $10,850 | $21,686 |
| 2016 | $450 | $29,967 | $7,700 | $22,267 |
| 2015 | $448 | $24,781 | $5,250 | $19,531 |
| 2014 | $434 | $16,678 | $3,500 | $13,178 |
Source: Public Records
Map
Nearby Homes
- 2281 Los Feliz St
- 2311 Sierra Sunrise St
- 2362 Sierra Sunrise St
- 2337 Sierra Sunrise St
- 7054 Burcot Ave Unit 40
- 7090 Burcot Ave Unit B32
- 2170 Dragon Claw Ln
- 6955 Appleton Dr
- 7040 Canary Ivy Way
- 7055 Canary Ivy Way
- 7253 Alsop Ct
- 2305 Exeter Dr
- 6928 Appleton Dr
- 2110 Los Feliz St Unit 2037
- 2110 Los Feliz St Unit 2069
- 2110 Los Feliz St Unit 2091
- 2110 Los Feliz St Unit 1096
- 2110 Los Feliz St Unit 1034
- 2110 Los Feliz St Unit 1066
- 2110 Los Feliz St Unit 2064
- 2341 Los Feliz St
- 2323 Los Feliz St
- 2347 Los Feliz St
- 2334 Sabroso St
- 2340 Sabroso St
- 2328 Sabroso St
- 2317 Los Feliz St
- 2353 Los Feliz St
- 2322 Sabroso St
- 2346 Sabroso St
- 2352 Sabroso St
- 2359 Los Feliz St
- 2358 Sabroso St
- 2310 Sabroso St
- 2362 Los Feliz St
- 2356 Los Feliz St
- 2356 Los Feliz St Unit n/a
- 2305 Los Feliz St
- 2365 Los Feliz St