2336 Benjamin St Morganton, NC 28655
Estimated Value: $404,719 - $436,000
3
Beds
2
Baths
1,930
Sq Ft
$217/Sq Ft
Est. Value
About This Home
This home is located at 2336 Benjamin St, Morganton, NC 28655 and is currently estimated at $419,180, approximately $217 per square foot. 2336 Benjamin St is a home located in Burke County with nearby schools including Salem Elementary School, Liberty Middle School, and Robert L. Patton High School.
Ownership History
Date
Name
Owned For
Owner Type
Purchase Details
Closed on
Jul 19, 2022
Sold by
Rehr Jeffrey L and Rehr Diane
Bought by
Deaton Shannon Lamar and Deaton Renee Spoon
Current Estimated Value
Home Financials for this Owner
Home Financials are based on the most recent Mortgage that was taken out on this home.
Original Mortgage
$120,000
Outstanding Balance
$113,647
Interest Rate
5.23%
Mortgage Type
New Conventional
Estimated Equity
$305,533
Purchase Details
Closed on
Nov 21, 2017
Sold by
Porterfield Wanda L and Porterfield Rex E
Bought by
Rehr Jeffrey L and Rehr Diane
Home Financials for this Owner
Home Financials are based on the most recent Mortgage that was taken out on this home.
Original Mortgage
$154,000
Interest Rate
3.85%
Mortgage Type
New Conventional
Create a Home Valuation Report for This Property
The Home Valuation Report is an in-depth analysis detailing your home's value as well as a comparison with similar homes in the area
Home Values in the Area
Average Home Value in this Area
Purchase History
| Date | Buyer | Sale Price | Title Company |
|---|---|---|---|
| Deaton Shannon Lamar | $370,000 | None Listed On Document | |
| Rehr Jeffrey L | $195,000 | None Available |
Source: Public Records
Mortgage History
| Date | Status | Borrower | Loan Amount |
|---|---|---|---|
| Open | Deaton Shannon Lamar | $120,000 | |
| Previous Owner | Rehr Jeffrey L | $154,000 |
Source: Public Records
Tax History
| Year | Tax Paid | Tax Assessment Tax Assessment Total Assessment is a certain percentage of the fair market value that is determined by local assessors to be the total taxable value of land and additions on the property. | Land | Improvement |
|---|---|---|---|---|
| 2025 | $2,022 | $294,668 | $26,238 | $268,430 |
| 2024 | $1,949 | $294,668 | $26,238 | $268,430 |
| 2023 | $1,949 | $294,668 | $26,238 | $268,430 |
| 2022 | $1,584 | $188,873 | $18,449 | $170,424 |
| 2021 | $1,521 | $188,873 | $18,449 | $170,424 |
| 2020 | $1,517 | $188,873 | $18,449 | $170,424 |
| 2019 | $1,517 | $188,873 | $18,449 | $170,424 |
| 2018 | $1,410 | $174,873 | $18,449 | $156,424 |
| 2017 | $1,367 | $169,497 | $18,449 | $151,048 |
| 2016 | $1,328 | $169,497 | $18,449 | $151,048 |
| 2015 | $1,325 | $169,497 | $18,449 | $151,048 |
| 2014 | $1,323 | $169,497 | $18,449 | $151,048 |
| 2013 | $1,323 | $169,497 | $18,449 | $151,048 |
Source: Public Records
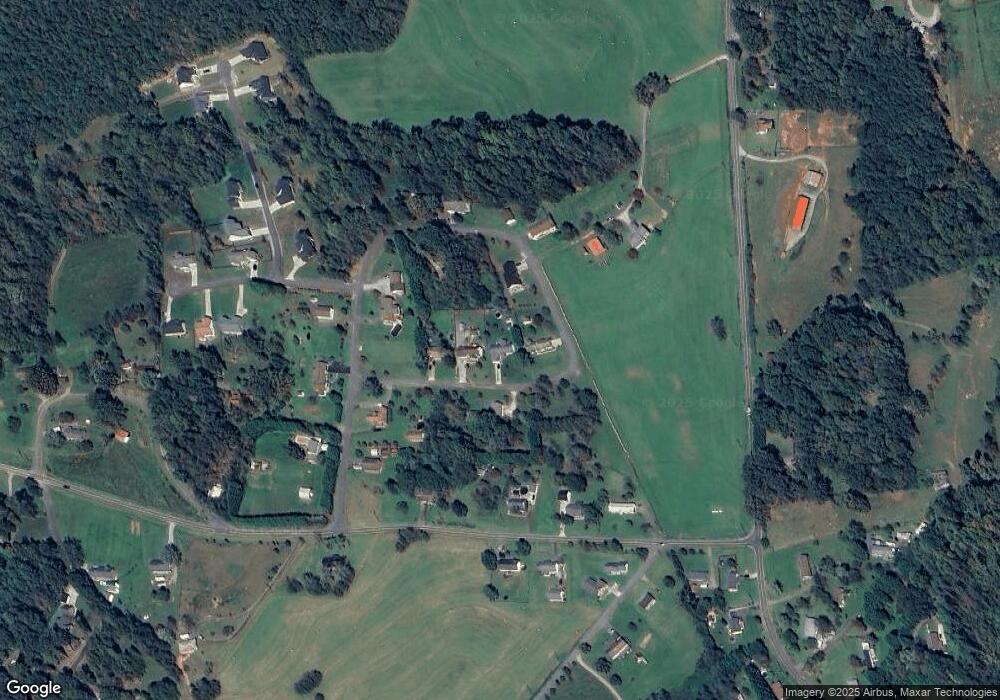
Map
Nearby Homes
- 4390 Belmont Dr
- 4314 Belmont Dr
- 2301 Saratoga Run
- 2522 Saratoga Run
- 2490 Saratoga Run
- 4331 Acorn Trace
- 2153 S Fork Dr
- 578 Conley Rd Unit 37 and 38
- 00 Paul Shuping Ave
- 0 Paul Shuping Ave
- 1940 Paul Shuping Ave
- 129 Brentwood Rd
- 109 Dogwood Ct
- 4391 Boulder Dr Unit 20
- 2791 Cornwell Dr
- 1380 Jacobs Ln
- 113 Highlander St
- 1633 Jamestown Rd
- 3687 Cornwell Dr Unit 138
- 826 Jamestown Rd
- 2348 Benjamin St
- 2322 Benjamin St
- 2362 Benjamin St
- 3961 Bel Aire Dr
- 3995 Bel Aire Dr
- 2345 Benjamin St
- 4011 Bel Aire Dr
- 3958 Bel Aire Dr
- 2377 Benjamin St
- 2334 Byrd Rd
- 3976 Bel Aire Dr
- 2322 Byrd Rd
- 2366 Byrd Rd
- 1306 Hopewell Rd
- 4079 Bel Aire Dr
- 3996 Bel Aire Dr
- 3998 Bel Aire Dr
- 2304 Byrd Rd
- 4042 Bel Aire Dr
- 4068 Bel Aire Dr
Your Personal Tour Guide
Ask me questions while you tour the home.