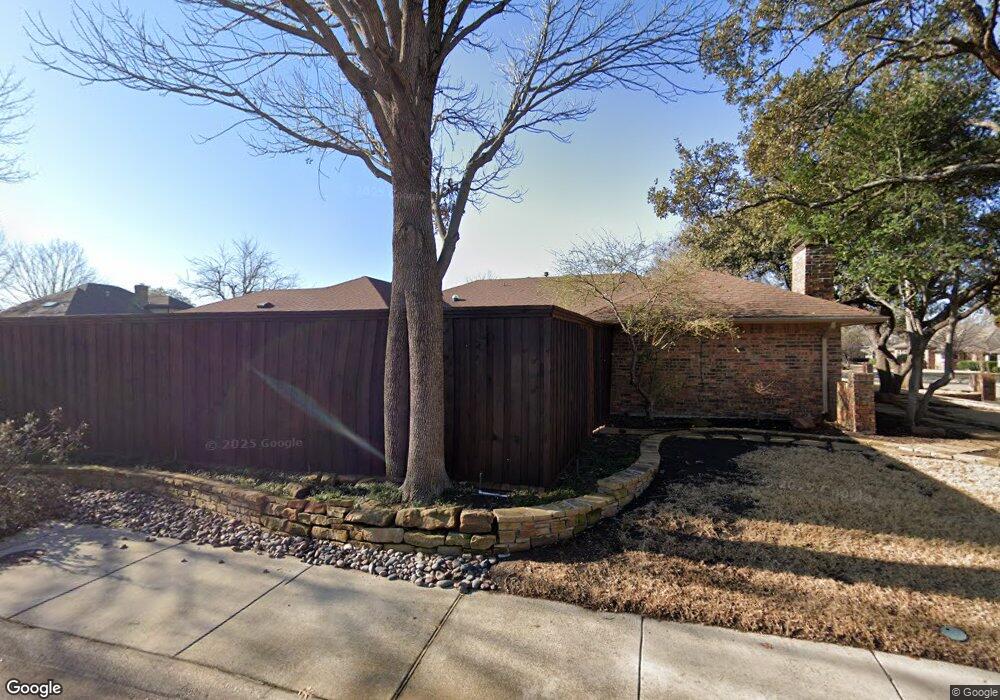
2336 Castle Rock Rd Carrollton, TX 75007
Meadow Ridge/Harvest Run NeighborhoodEstimated Value: $499,000 - $536,381
3
Beds
3
Baths
2,397
Sq Ft
$216/Sq Ft
Est. Value
About This Home
This home is located at 2336 Castle Rock Rd, Carrollton, TX 75007 and is currently estimated at $517,845, approximately $216 per square foot. 2336 Castle Rock Rd is a home located in Denton County with nearby schools including Sheffield Elementary School, Long Middle School, and Smith High School.
Ownership History
Date
Name
Owned For
Owner Type
Purchase Details
Closed on
Jun 6, 2013
Sold by
Carter William R and Carter Bobbi R
Bought by
Martin Leonard A and Martin Brenda K
Current Estimated Value
Home Financials for this Owner
Home Financials are based on the most recent Mortgage that was taken out on this home.
Original Mortgage
$195,450
Outstanding Balance
$138,535
Interest Rate
3.41%
Mortgage Type
New Conventional
Estimated Equity
$379,310
Purchase Details
Closed on
Jul 20, 2001
Sold by
Carter William R
Bought by
Carter Bobbi R
Home Financials for this Owner
Home Financials are based on the most recent Mortgage that was taken out on this home.
Original Mortgage
$165,100
Interest Rate
7.05%
Purchase Details
Closed on
Dec 22, 1999
Sold by
Bynum Katherine B
Bought by
Carter William R
Home Financials for this Owner
Home Financials are based on the most recent Mortgage that was taken out on this home.
Original Mortgage
$165,300
Interest Rate
7.69%
Create a Home Valuation Report for This Property
The Home Valuation Report is an in-depth analysis detailing your home's value as well as a comparison with similar homes in the area
Home Values in the Area
Average Home Value in this Area
Purchase History
| Date | Buyer | Sale Price | Title Company |
|---|---|---|---|
| Martin Leonard A | -- | Rtt | |
| Carter Bobbi R | -- | -- | |
| Carter William R | -- | -- |
Source: Public Records
Mortgage History
| Date | Status | Borrower | Loan Amount |
|---|---|---|---|
| Open | Martin Leonard A | $195,450 | |
| Previous Owner | Carter Bobbi R | $165,100 | |
| Previous Owner | Carter William R | $165,300 | |
| Closed | Carter William R | $30,950 |
Source: Public Records
Tax History Compared to Growth
Tax History
| Year | Tax Paid | Tax Assessment Tax Assessment Total Assessment is a certain percentage of the fair market value that is determined by local assessors to be the total taxable value of land and additions on the property. | Land | Improvement |
|---|---|---|---|---|
| 2025 | $2,576 | $517,000 | $128,472 | $388,528 |
| 2024 | $8,728 | $510,367 | $0 | $0 |
| 2023 | $2,451 | $463,970 | $121,835 | $381,165 |
| 2022 | $8,111 | $421,791 | $109,984 | $330,156 |
| 2021 | $7,927 | $396,806 | $79,988 | $316,818 |
| 2020 | $7,263 | $348,587 | $79,988 | $268,599 |
| 2019 | $7,548 | $344,592 | $79,988 | $264,604 |
| 2018 | $6,978 | $314,526 | $60,291 | $254,747 |
| 2017 | $6,416 | $285,933 | $60,291 | $225,642 |
| 2016 | $3,889 | $280,218 | $60,291 | $224,621 |
| 2015 | $3,689 | $254,744 | $60,291 | $223,343 |
| 2013 | -- | $210,532 | $60,291 | $150,241 |
Source: Public Records
Map
Nearby Homes
- 2302 Stone Glen Ln
- 3719 Canon Gate Cir
- 2304 Colleen Ct
- 18816 Bilbrook Ln
- 3701 Canon Gate Cir
- 2111 Stein Way
- 3416 Livingston Ln
- 3708 Old Orchard Ct
- 2514 Fallview Ln
- 2707 Monet Place
- 2115 Alto Ave
- 2206 Red Bluff Dr
- 2017 Stein Way
- 2909 Gainesborough Dr
- 2818 Monet Place
- 2124 Lymington Rd
- 18515 Timber Oaks Dr
- 3913 Alto Ave
- 1920 Avignon Ct
- 2028 Victoria Rd
- 2334 Castle Rock Rd
- 3715 Bishop Hill Dr
- 2332 Castle Rock Rd
- 2331 Castle Rock Rd
- 3713 Bishop Hill Dr
- 2327 Highlands Creek Rd
- 2329 Castle Rock Rd
- 2327 Castle Rock Rd
- 2325 Highlands Creek Rd
- 3711 Bishop Hill Dr
- 2330 Castle Rock Rd
- 2331 Highlands Creek Rd
- 2325 Castle Rock Rd
- 2323 Highlands Creek Rd
- 3709 Bishop Hill Dr
- 2332 Dundee Place
- 2328 Castle Rock Rd
- 2330 Dundee Place
- 2334 Highlands Creek Rd
- 2328 Dundee Place