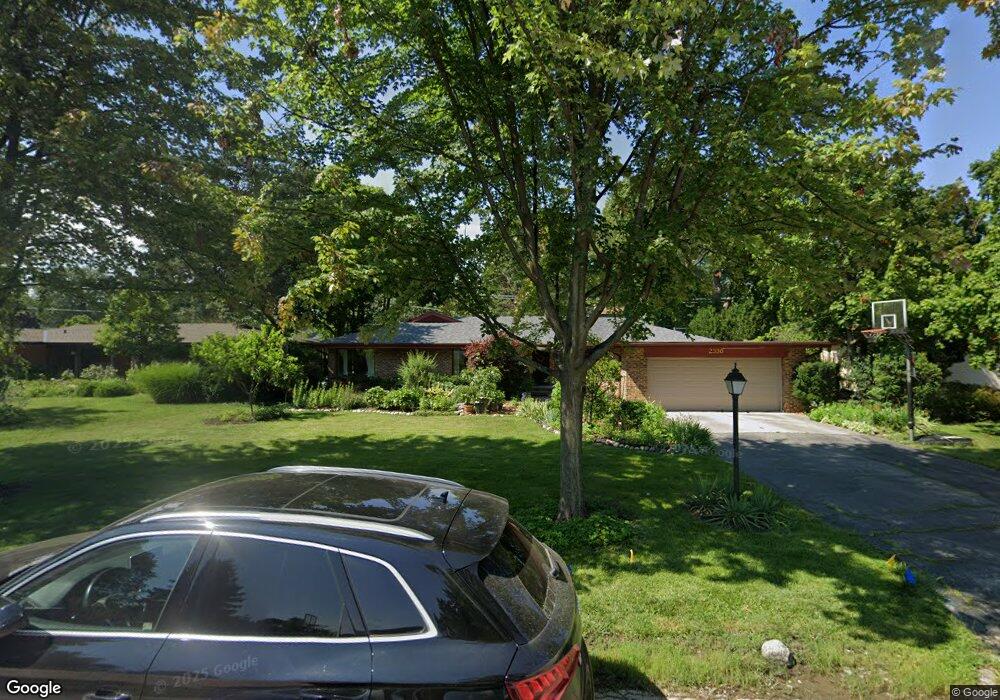
2336 Fir St Glenview, IL 60025
Estimated Value: $948,000 - $1,169,000
5
Beds
3
Baths
2,674
Sq Ft
$384/Sq Ft
Est. Value
About This Home
This home is located at 2336 Fir St, Glenview, IL 60025 and is currently estimated at $1,025,617, approximately $383 per square foot. 2336 Fir St is a home located in Cook County with nearby schools including Lyon Elementary School, Pleasant Ridge Elementary School, and Springman Middle School.
Ownership History
Date
Name
Owned For
Owner Type
Purchase Details
Closed on
Nov 13, 2000
Sold by
Harris Bank Hinsdale Na
Bought by
Awad Adel K and Awad Margaret N
Current Estimated Value
Purchase Details
Closed on
Jun 15, 1994
Sold by
Lasalle National Trust Na
Bought by
Pollick John F and Pollick Yuan C
Home Financials for this Owner
Home Financials are based on the most recent Mortgage that was taken out on this home.
Original Mortgage
$280,000
Interest Rate
7.25%
Mortgage Type
Purchase Money Mortgage
Create a Home Valuation Report for This Property
The Home Valuation Report is an in-depth analysis detailing your home's value as well as a comparison with similar homes in the area
Home Values in the Area
Average Home Value in this Area
Purchase History
| Date | Buyer | Sale Price | Title Company |
|---|---|---|---|
| Awad Adel K | $95,000 | 1St American Title | |
| Pollick John F | $377,500 | -- |
Source: Public Records
Mortgage History
| Date | Status | Borrower | Loan Amount |
|---|---|---|---|
| Previous Owner | Pollick John F | $280,000 |
Source: Public Records
Tax History Compared to Growth
Tax History
| Year | Tax Paid | Tax Assessment Tax Assessment Total Assessment is a certain percentage of the fair market value that is determined by local assessors to be the total taxable value of land and additions on the property. | Land | Improvement |
|---|---|---|---|---|
| 2024 | $15,179 | $74,545 | $18,632 | $55,913 |
| 2023 | $15,855 | $74,545 | $18,632 | $55,913 |
| 2022 | $15,855 | $79,867 | $18,632 | $61,235 |
| 2021 | $14,137 | $62,794 | $15,138 | $47,656 |
| 2020 | $14,070 | $62,794 | $15,138 | $47,656 |
| 2019 | $13,106 | $69,005 | $15,138 | $53,867 |
| 2018 | $12,027 | $58,478 | $13,100 | $45,378 |
| 2017 | $11,731 | $58,478 | $13,100 | $45,378 |
| 2016 | $11,842 | $58,478 | $13,100 | $45,378 |
| 2015 | $12,002 | $53,023 | $10,480 | $42,543 |
| 2014 | $11,795 | $53,023 | $10,480 | $42,543 |
| 2013 | $12,295 | $56,874 | $10,480 | $46,394 |
Source: Public Records
Map
Nearby Homes
- 1088 Shermer Rd Unit DW
- 2137 Glenview Rd
- 2156 Rugen Rd Unit A
- 1900 E Lake Ave
- 2750 Langley Cir Unit 203013
- 1619 Patriot Blvd
- 1341 Greenwillow Ln Unit C
- 1220 Depot St Unit 305
- 1220 Depot St Unit 109
- 1220 Depot St Unit 409
- 1735 Patriot Blvd
- 2701 Commons Dr Unit 210
- 1342 Pine St
- 1800 Dewes St Unit 305
- 1800 Dewes St Unit 201