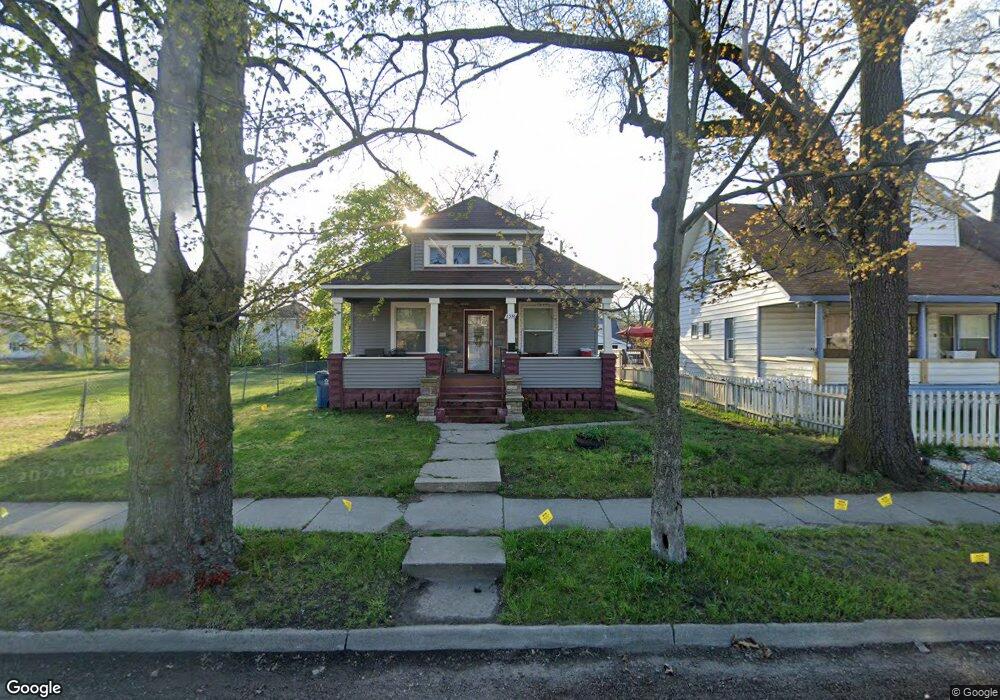
2336 Peck St Muskegon, MI 49444
Estimated Value: $107,000 - $121,000
2
Beds
1
Bath
1,299
Sq Ft
$88/Sq Ft
Est. Value
About This Home
This home is located at 2336 Peck St, Muskegon, MI 49444 and is currently estimated at $114,246, approximately $87 per square foot. 2336 Peck St is a home located in Muskegon County with nearby schools including Edgewood Elementary Academy, Dr. Martin Luther King Academy, and Muskegon Heights Academy.
Ownership History
Date
Name
Owned For
Owner Type
Purchase Details
Closed on
Aug 12, 2009
Sold by
County Of Muskegon
Bought by
Selmon James O
Current Estimated Value
Purchase Details
Closed on
Feb 16, 2007
Sold by
Nielsen Roger and Nielsen Juanita
Bought by
Banks Turner Beverly
Home Financials for this Owner
Home Financials are based on the most recent Mortgage that was taken out on this home.
Original Mortgage
$12,000
Interest Rate
6.27%
Mortgage Type
Seller Take Back
Purchase Details
Closed on
Feb 12, 2003
Sold by
Department Of Natural Resources
Bought by
City Of Muskegon Heights
Create a Home Valuation Report for This Property
The Home Valuation Report is an in-depth analysis detailing your home's value as well as a comparison with similar homes in the area
Home Values in the Area
Average Home Value in this Area
Purchase History
| Date | Buyer | Sale Price | Title Company |
|---|---|---|---|
| Selmon James O | $2,550 | None Available | |
| Banks Turner Beverly | -- | None Available | |
| City Of Muskegon Heights | $660 | -- |
Source: Public Records
Mortgage History
| Date | Status | Borrower | Loan Amount |
|---|---|---|---|
| Previous Owner | Banks Turner Beverly | $12,000 |
Source: Public Records
Tax History Compared to Growth
Tax History
| Year | Tax Paid | Tax Assessment Tax Assessment Total Assessment is a certain percentage of the fair market value that is determined by local assessors to be the total taxable value of land and additions on the property. | Land | Improvement |
|---|---|---|---|---|
| 2025 | $1,251 | $46,500 | $0 | $0 |
| 2024 | $927 | $35,300 | $0 | $0 |
| 2023 | $1,012 | $25,200 | $0 | $0 |
| 2022 | $1,381 | $23,700 | $0 | $0 |
| 2021 | $11,446 | $20,500 | $0 | $0 |
| 2020 | $1,332 | $18,500 | $0 | $0 |
| 2019 | $1,308 | $17,200 | $0 | $0 |
| 2018 | $1,126 | $14,900 | $0 | $0 |
| 2017 | $1,044 | $14,500 | $0 | $0 |
| 2016 | $729 | $14,900 | $0 | $0 |
| 2015 | -- | $15,400 | $0 | $0 |
| 2014 | -- | $14,800 | $0 | $0 |
| 2013 | -- | $12,400 | $0 | $0 |
Source: Public Records
Map
Nearby Homes