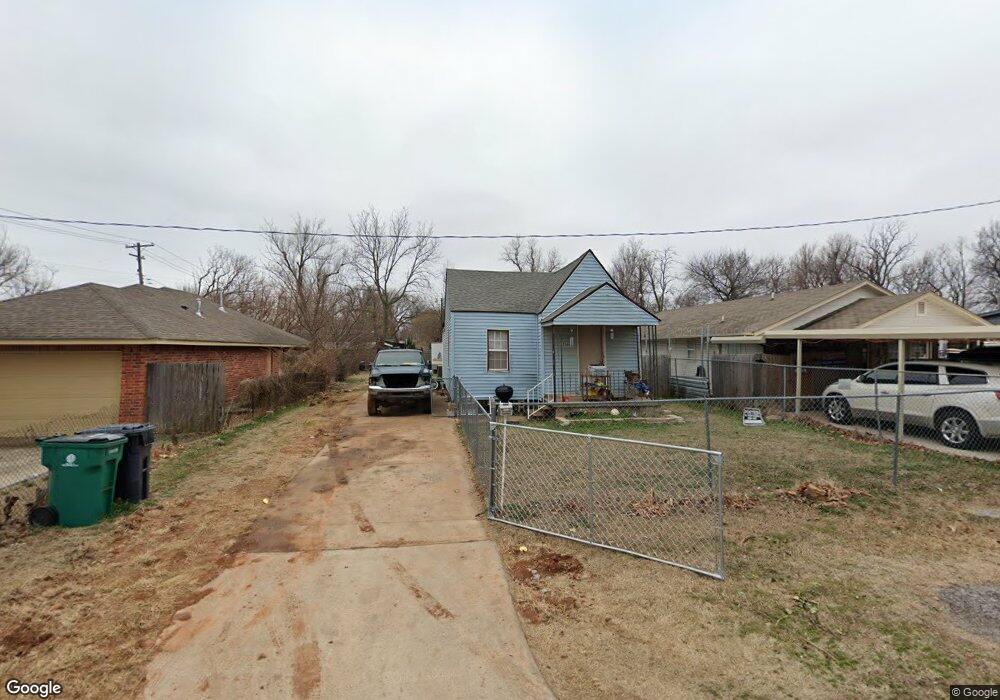
2336 SE 10th St Oklahoma City, OK 73129
Akers Park NeighborhoodEstimated Value: $66,000 - $96,000
2
Beds
1
Bath
681
Sq Ft
$119/Sq Ft
Est. Value
About This Home
This home is located at 2336 SE 10th St, Oklahoma City, OK 73129 and is currently estimated at $81,302, approximately $119 per square foot. 2336 SE 10th St is a home located in Oklahoma County with nearby schools including Central Oak Elementary School, Crooked Oak Middle School, and Crooked Oak High School.
Ownership History
Date
Name
Owned For
Owner Type
Purchase Details
Closed on
Oct 18, 2019
Sold by
Williams Temethy
Bought by
Hodge Richard D
Current Estimated Value
Home Financials for this Owner
Home Financials are based on the most recent Mortgage that was taken out on this home.
Original Mortgage
$161,060
Outstanding Balance
$140,806
Interest Rate
3.4%
Mortgage Type
New Conventional
Estimated Equity
-$59,504
Purchase Details
Closed on
Jun 10, 2019
Sold by
Walker Kathy
Bought by
Hodge Richard
Purchase Details
Closed on
Mar 25, 2019
Sold by
Turner Jolene
Bought by
Hodge Richard
Purchase Details
Closed on
Aug 16, 2011
Sold by
Havin Investments Llc
Bought by
Walker Kathy and Johnson Nyhoka
Home Financials for this Owner
Home Financials are based on the most recent Mortgage that was taken out on this home.
Original Mortgage
$14,000
Interest Rate
4.65%
Mortgage Type
Seller Take Back
Create a Home Valuation Report for This Property
The Home Valuation Report is an in-depth analysis detailing your home's value as well as a comparison with similar homes in the area
Home Values in the Area
Average Home Value in this Area
Purchase History
| Date | Buyer | Sale Price | Title Company |
|---|---|---|---|
| Hodge Richard D | -- | None Available | |
| Hodge Richard D | -- | None Available | |
| Hodge Richard | $1,000 | None Available | |
| Hodge Richard | -- | None Available | |
| Walker Kathy | $14,000 | None Available |
Source: Public Records
Mortgage History
| Date | Status | Borrower | Loan Amount |
|---|---|---|---|
| Open | Hodge Richard D | $161,060 | |
| Previous Owner | Walker Kathy | $14,000 |
Source: Public Records
Tax History Compared to Growth
Tax History
| Year | Tax Paid | Tax Assessment Tax Assessment Total Assessment is a certain percentage of the fair market value that is determined by local assessors to be the total taxable value of land and additions on the property. | Land | Improvement |
|---|---|---|---|---|
| 2024 | $341 | $2,827 | $357 | $2,470 |
| 2023 | $341 | $2,693 | $413 | $2,280 |
| 2022 | $334 | $2,565 | $547 | $2,018 |
| 2021 | $313 | $2,443 | $617 | $1,826 |
| 2020 | $307 | $2,327 | $679 | $1,648 |
| 2019 | $294 | $2,216 | $606 | $1,610 |
| 2018 | $262 | $2,111 | $0 | $0 |
| 2017 | $248 | $2,009 | $643 | $1,366 |
| 2016 | $230 | $1,914 | $628 | $1,286 |
| 2015 | $230 | $1,823 | $474 | $1,349 |
| 2014 | $226 | $1,736 | $464 | $1,272 |
Source: Public Records
Map
Nearby Homes
- 1333 S Fairmont Ave
- 2117 SE 12th St
- 1447 S Genessee Ave
- SE 15th St
- 601 SE 18th St
- 837 Briarlane Rd
- 4110 Indian Point Cir
- 3032 Beechwood Dr
- 1716 SE 20th St
- 833 S Scott St
- 3137 Delmar Rd
- 3201 Longridge Rd
- 3217 Beechwood Dr
- 3020 SE 20th St
- 3101 SE 20th St
- 127 SE 22nd St
- 1524 Hampton Dr
- 3316 Beechwood Dr
- 1001 Shalimar Dr
- 1228 Carter Dr
- 1001 S Fairmont Ave
- 2334 SE 10th St
- 2332 SE 10th St
- 1011 S Fairmont Ave
- 1013 S Fairmont Ave
- 2340 SE 9th St
- 945 S Fairmont Ave
- 2329 SE 11th St
- 2324 SE 10th St
- 2333 SE 10th St
- 2404 SE 10th St
- 2327 SE 11th St
- 1012 S Fairmont Ave
- 2405 SE 10th St
- 2325 SE 11th St
- 2320 SE 10th St
- 2329 SE 10th St
- 1016 S Fairmont Ave
- 2401 SE 10th St
- 2407 SE 11th St