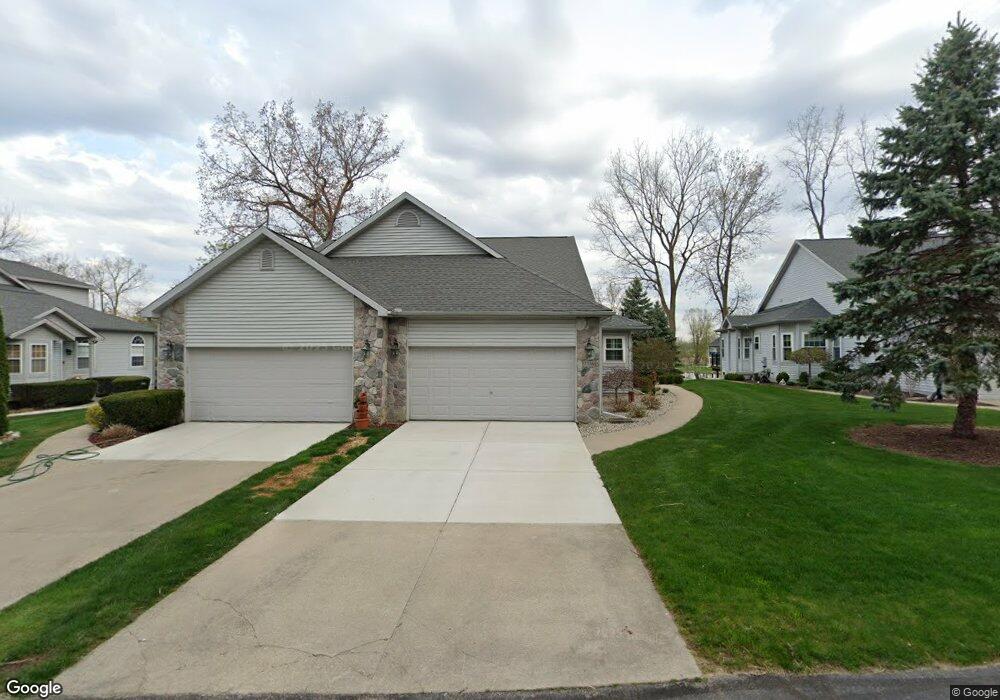
2336 Swans Cove Unit 7 Fenton, MI 48430
Estimated Value: $409,000 - $433,000
3
Beds
4
Baths
1,429
Sq Ft
$295/Sq Ft
Est. Value
About This Home
This home is located at 2336 Swans Cove Unit 7, Fenton, MI 48430 and is currently estimated at $422,005, approximately $295 per square foot. 2336 Swans Cove Unit 7 is a home located in Genesee County with nearby schools including West Shore Elementary School, Torrey Hill Intermediate School, and Lake Fenton Middle School.
Ownership History
Date
Name
Owned For
Owner Type
Purchase Details
Closed on
Nov 7, 2012
Sold by
Kidder Nancy J and Wellman Ronald
Bought by
Kidder Nancy and The Trust Of Nancy Kidder
Current Estimated Value
Purchase Details
Closed on
Sep 24, 2004
Sold by
Portelli Frank C and Portelli Theresa L
Bought by
Kidder Nancy J
Home Financials for this Owner
Home Financials are based on the most recent Mortgage that was taken out on this home.
Original Mortgage
$144,000
Interest Rate
5.93%
Mortgage Type
Unknown
Purchase Details
Closed on
Jul 6, 2001
Sold by
Maxheimer Ronald J
Bought by
Portelli Frank C and Portelli Theresa L
Home Financials for this Owner
Home Financials are based on the most recent Mortgage that was taken out on this home.
Original Mortgage
$70,000
Interest Rate
7.27%
Create a Home Valuation Report for This Property
The Home Valuation Report is an in-depth analysis detailing your home's value as well as a comparison with similar homes in the area
Home Values in the Area
Average Home Value in this Area
Purchase History
| Date | Buyer | Sale Price | Title Company |
|---|---|---|---|
| Kidder Nancy | -- | None Available | |
| Kidder Nancy J | $244,000 | Cislo Title Company | |
| Portelli Frank C | $255,000 | Lawyers Title Insurance Corp |
Source: Public Records
Mortgage History
| Date | Status | Borrower | Loan Amount |
|---|---|---|---|
| Closed | Kidder Nancy J | $144,000 | |
| Previous Owner | Portelli Frank C | $70,000 |
Source: Public Records
Tax History Compared to Growth
Tax History
| Year | Tax Paid | Tax Assessment Tax Assessment Total Assessment is a certain percentage of the fair market value that is determined by local assessors to be the total taxable value of land and additions on the property. | Land | Improvement |
|---|---|---|---|---|
| 2025 | $5,355 | $202,900 | $0 | $0 |
| 2024 | $1,185 | $191,800 | $0 | $0 |
| 2023 | $1,130 | $146,900 | $0 | $0 |
| 2022 | $4,968 | $132,500 | $0 | $0 |
| 2021 | $3,619 | $119,400 | $0 | $0 |
| 2020 | $1,034 | $111,700 | $0 | $0 |
| 2019 | $988 | $110,500 | $0 | $0 |
| 2018 | $2,996 | $107,800 | $0 | $0 |
| 2017 | $2,821 | $102,700 | $0 | $0 |
| 2016 | $2,803 | $86,500 | $0 | $0 |
| 2015 | $2,763 | $83,200 | $0 | $0 |
| 2014 | $911 | $80,200 | $0 | $0 |
| 2012 | -- | $76,100 | $76,100 | $0 |
Source: Public Records
Map
Nearby Homes
- 2369 Golden Shores Dr
- 2361 Golden Shore Dr
- 13293 Lake Shore Dr
- 2414 Cranewood Dr
- 2497 Golden Shores Dr
- 2509 Golden Shores Dr
- 2447 Grove Park Rd
- 2379 Grove Park Rd
- 14010 Torrey Rd
- 3130 Harbor Pointe Cir Unit 64
- 3129 Harbor Pointe Cir
- 14108 North Rd
- 13056 Cussewago Dr
- 13167 Harbor Landings Dr
- 13281 Haddon St
- 13366 Wenwood Dr
- 15000 North Rd
- 2040 Linden St
- 12364 Saint Andrews Way Unit 66
- 12410 Woodhull Landing
- 2338 Swans Cove
- 545 Edgewood Pass Unit Bldg-Unit
- 520 Cascade Ave Unit Bldg-Unit
- 595 Cascade Ave Unit Bldg-Unit
- 440 Edgewood Pass
- 540 Cascade Ave
- 670 Cascade Ave
- 675 Cascade Ave
- 635 Cascade Ave
- 660 Cascade Ave
- 535 Cascade Ave
- 575 Cascade Ave
- 665 Cascade Ave
- 545 Edgewood Pass
- 520 Cascade Ave
- 595 Cascade Ave
- 535 Edgewood Pass
- 705 Cascade Ave
- 525 Cascade Ave
- 665 Cascade Ave