Estimated Value: $409,000 - $428,000
6
Beds
2
Baths
2,214
Sq Ft
$190/Sq Ft
Est. Value
About This Home
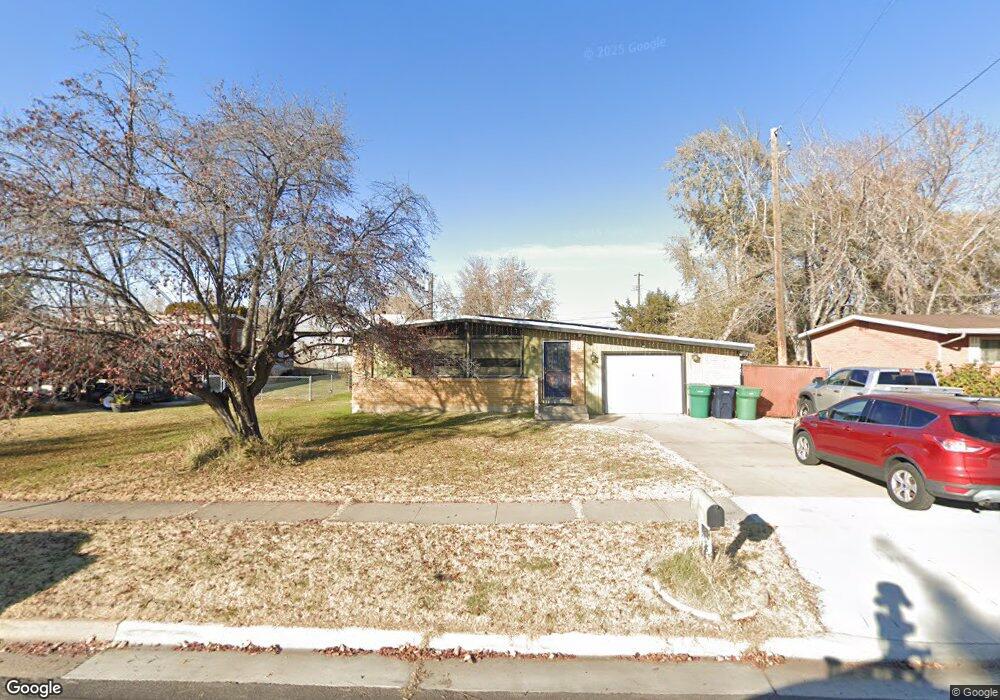
This home is located at 2336 W 4400 S, Roy, UT 84067 and is currently estimated at $420,625, approximately $189 per square foot. 2336 W 4400 S is a home located in Weber County with nearby schools including North Park School, Sand Ridge Junior High School, and Roy High School.
Ownership History
Date
Name
Owned For
Owner Type
Purchase Details
Closed on
Aug 10, 2015
Sold by
Reed Victoria L and Reed Robert J
Bought by
Rose Jared J and Rose Arthur L
Current Estimated Value
Home Financials for this Owner
Home Financials are based on the most recent Mortgage that was taken out on this home.
Original Mortgage
$165,938
Outstanding Balance
$130,153
Interest Rate
3.95%
Mortgage Type
FHA
Estimated Equity
$290,472
Purchase Details
Closed on
Mar 8, 2007
Sold by
Shepherd Janice
Bought by
Reed Robert J and Reed Victoria L
Home Financials for this Owner
Home Financials are based on the most recent Mortgage that was taken out on this home.
Original Mortgage
$31,600
Interest Rate
5.97%
Mortgage Type
Stand Alone Second
Purchase Details
Closed on
Jun 24, 2002
Sold by
Cutler Jeff and Cutler Michelle
Bought by
Shepherd Janice
Home Financials for this Owner
Home Financials are based on the most recent Mortgage that was taken out on this home.
Original Mortgage
$115,093
Interest Rate
6.86%
Create a Home Valuation Report for This Property
The Home Valuation Report is an in-depth analysis detailing your home's value as well as a comparison with similar homes in the area
Home Values in the Area
Average Home Value in this Area
Purchase History
| Date | Buyer | Sale Price | Title Company |
|---|---|---|---|
| Rose Jared J | -- | Mountain View Title Ogden | |
| Reed Robert J | -- | First American Title Riverda | |
| Shepherd Janice | -- | Bonneville Title Company |
Source: Public Records
Mortgage History
| Date | Status | Borrower | Loan Amount |
|---|---|---|---|
| Open | Rose Jared J | $165,938 | |
| Previous Owner | Reed Robert J | $31,600 | |
| Previous Owner | Reed Robert J | $126,400 | |
| Previous Owner | Shepherd Janice | $115,093 | |
| Closed | Shepherd Janice | $3,507 |
Source: Public Records
Tax History Compared to Growth
Tax History
| Year | Tax Paid | Tax Assessment Tax Assessment Total Assessment is a certain percentage of the fair market value that is determined by local assessors to be the total taxable value of land and additions on the property. | Land | Improvement |
|---|---|---|---|---|
| 2025 | $2,422 | $379,310 | $119,997 | $259,313 |
| 2024 | $2,365 | $205,149 | $66,006 | $139,143 |
| 2023 | $2,263 | $196,350 | $60,222 | $136,128 |
| 2022 | $2,243 | $200,200 | $52,148 | $148,052 |
| 2021 | $1,811 | $264,000 | $66,684 | $197,316 |
| 2020 | $1,689 | $226,000 | $66,684 | $159,316 |
| 2019 | $1,762 | $224,000 | $39,033 | $184,967 |
| 2018 | $1,630 | $194,000 | $36,203 | $157,797 |
| 2017 | $1,545 | $172,000 | $36,203 | $135,797 |
| 2016 | $1,387 | $82,150 | $17,010 | $65,140 |
| 2015 | $1,289 | $77,936 | $17,010 | $60,926 |
| 2014 | $1,271 | $75,950 | $17,010 | $58,940 |
Source: Public Records
Map
Nearby Homes