Estimated Value: $812,000 - $885,000
4
Beds
3
Baths
3,178
Sq Ft
$265/Sq Ft
Est. Value
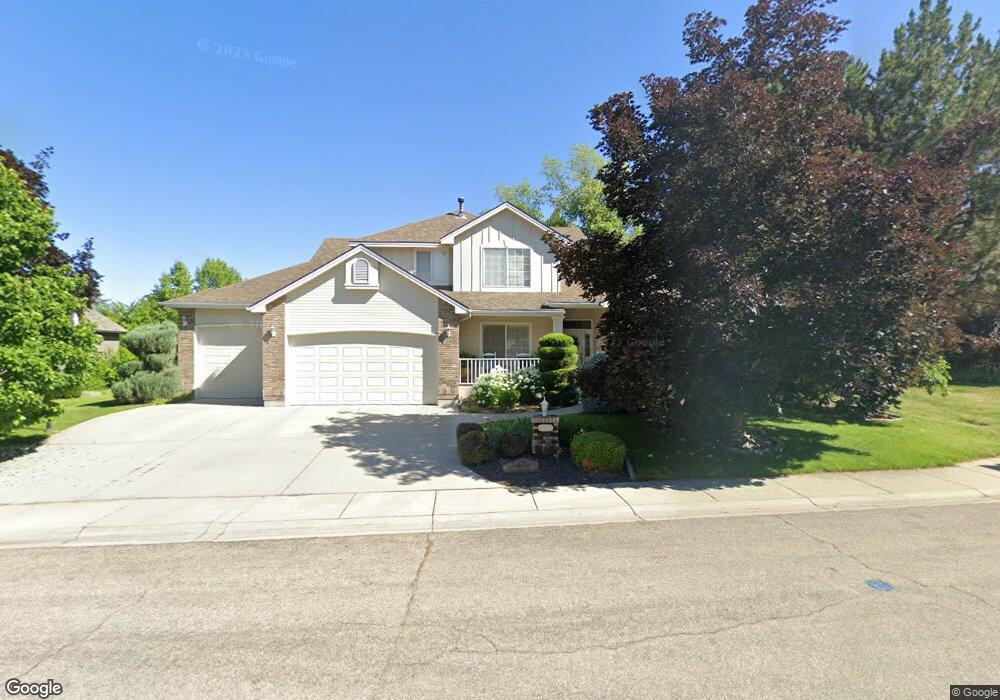
About This Home
This home is located at 2338 E Shalimar Dr, Eagle, ID 83616 and is currently estimated at $841,290, approximately $264 per square foot. 2338 E Shalimar Dr is a home located in Ada County with nearby schools including Seven Oaks Elementary School, Eagle Middle School, and Eagle High School.
Ownership History
Date
Name
Owned For
Owner Type
Purchase Details
Closed on
Jul 15, 1998
Sold by
Gordon Smith Homes Inc
Bought by
King Dennis F and King Dona Pike
Current Estimated Value
Home Financials for this Owner
Home Financials are based on the most recent Mortgage that was taken out on this home.
Original Mortgage
$227,150
Outstanding Balance
$46,485
Interest Rate
7%
Mortgage Type
Purchase Money Mortgage
Estimated Equity
$794,805
Purchase Details
Closed on
Apr 28, 1998
Sold by
King Dennis F and King Dona Pike
Bought by
Gordon Smith Homes Inc
Purchase Details
Closed on
Mar 17, 1998
Sold by
Moore Morgan C and Moore Jo Ann
Bought by
King Dennis F and King Dona Pike
Purchase Details
Closed on
Jan 28, 1997
Sold by
Lexington Hills Inc
Bought by
Moore Morgan C and Moore Jo Anne
Create a Home Valuation Report for This Property
The Home Valuation Report is an in-depth analysis detailing your home's value as well as a comparison with similar homes in the area
Home Values in the Area
Average Home Value in this Area
Purchase History
| Date | Buyer | Sale Price | Title Company |
|---|---|---|---|
| King Dennis F | -- | Pioneer Title Company | |
| Gordon Smith Homes Inc | -- | Pioneer Title Company | |
| King Dennis F | -- | Transnation Title & Escrow I | |
| Moore Morgan C | -- | Transnation Title & Escrow |
Source: Public Records
Mortgage History
| Date | Status | Borrower | Loan Amount |
|---|---|---|---|
| Open | King Dennis F | $227,150 | |
| Closed | King Dennis F | $30,700 |
Source: Public Records
Tax History
| Year | Tax Paid | Tax Assessment Tax Assessment Total Assessment is a certain percentage of the fair market value that is determined by local assessors to be the total taxable value of land and additions on the property. | Land | Improvement |
|---|---|---|---|---|
| 2025 | $2,727 | $821,100 | -- | -- |
| 2024 | $2,889 | $794,700 | -- | -- |
| 2023 | $2,889 | $769,200 | $0 | $0 |
| 2022 | $3,518 | $912,900 | $0 | $0 |
| 2021 | $3,128 | $647,100 | $0 | $0 |
| 2020 | $3,352 | $531,400 | $0 | $0 |
| 2019 | $3,936 | $513,900 | $0 | $0 |
| 2018 | $3,494 | $441,700 | $0 | $0 |
| 2017 | $3,271 | $402,700 | $0 | $0 |
| 2016 | $3,191 | $376,800 | $0 | $0 |
| 2015 | $3,135 | $372,400 | $0 | $0 |
| 2012 | -- | $264,600 | $0 | $0 |
Source: Public Records
Map
Nearby Homes
- 1545 N Ellington Way
- 2231 N Parkforest Way
- 2949 E Pine Hollow Ln
- 981 N Falling Water Way
- 857 N Falling Water Way
- 834 N Falling Water Way
- 882 N Falling Water Way
- 1151 N Torrey Pines Ave
- 1712 E Myrtle Beach Ct
- 1133 N Torrey Pines Ave
- 2460 E Gleneagle St
- 2442 E Gleneagle St
- 900 N Falling Water Way
- 883 N Falling Water Way
- 2333 N Eagle Creek Ln
- 2457 Skokie Dr E
- 992 N Pinnacle Way
- 1536 E Daylesford Dr
- 1450 E Covey Run Ct
- 2315 E Monhegan Dr
- 2310 E Shalimar Dr
- 2352 E Shalimar Dr
- 1659 N Trellis Place
- 1664 N Trellis Place
- 2296 E Shalimar Dr
- 1741 N Sevenoaks Way
- 1637 N Trellis Place
- 1642 N Trellis Place
- 2282 E Shalimar Dr
- 1708 N Sevenoaks Way
- 1763 N Sevenoaks Way
- 1730 N Sevenoaks Way
- 2275 E Shalimar Dr
- 1738 N Longridge Place
- 2432 E Heathfield Ct
- 1620 N Trellis Place
- 1752 N Sevenoaks Way
- 1615 N Trellis Place
- 2268 E Shalimar Dr
- 1756 N Longridge Place
Your Personal Tour Guide
Ask me questions while you tour the home.