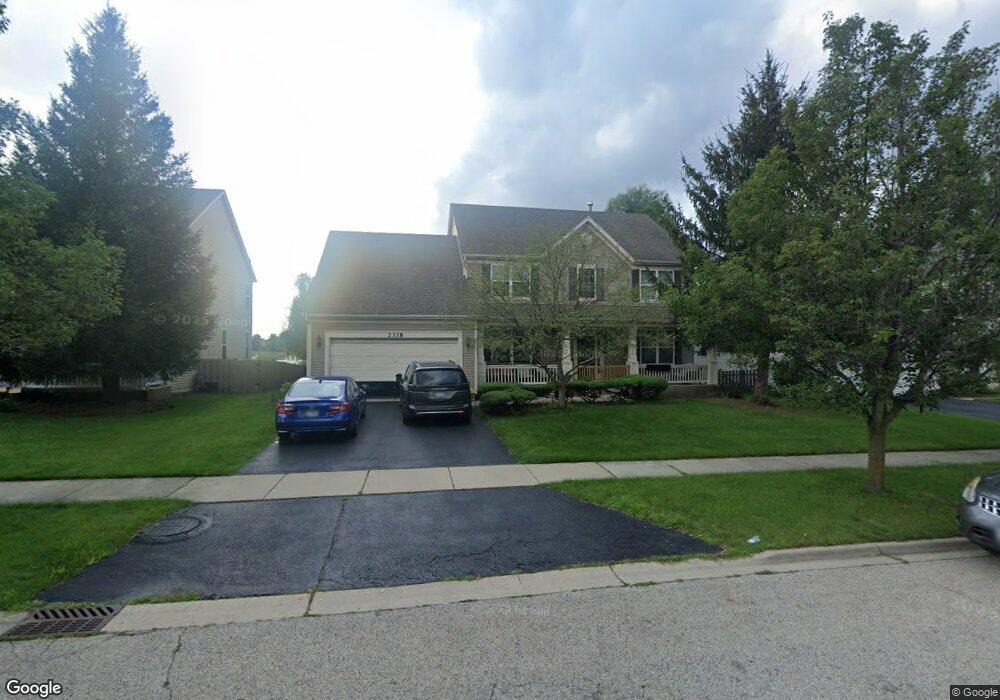
2338 Fishhook Way Wauconda, IL 60084
Estimated Value: $498,000 - $520,327
4
Beds
3
Baths
2,827
Sq Ft
$179/Sq Ft
Est. Value
About This Home
This home is located at 2338 Fishhook Way, Wauconda, IL 60084 and is currently estimated at $507,082, approximately $179 per square foot. 2338 Fishhook Way is a home located in Lake County with nearby schools including Robert Crown School, Wauconda Middle School, and Wauconda High School.
Ownership History
Date
Name
Owned For
Owner Type
Purchase Details
Closed on
Nov 19, 2022
Sold by
Charles Anton C
Bought by
Charles Shyrley Elizabeth
Current Estimated Value
Purchase Details
Closed on
Jun 14, 2017
Sold by
Rusanova Galina and Volkov Alexei
Bought by
Charles Anton C and Charles Shyrley Elizabeth
Home Financials for this Owner
Home Financials are based on the most recent Mortgage that was taken out on this home.
Original Mortgage
$304,385
Interest Rate
4.12%
Mortgage Type
FHA
Purchase Details
Closed on
Aug 4, 2014
Sold by
Rusanova Galina
Bought by
Rusanova Galina and Volkov Alexei
Purchase Details
Closed on
Aug 23, 2004
Sold by
Pinnacle Corp
Bought by
Rusanova Galina
Home Financials for this Owner
Home Financials are based on the most recent Mortgage that was taken out on this home.
Original Mortgage
$225,250
Interest Rate
4.75%
Mortgage Type
New Conventional
Create a Home Valuation Report for This Property
The Home Valuation Report is an in-depth analysis detailing your home's value as well as a comparison with similar homes in the area
Home Values in the Area
Average Home Value in this Area
Purchase History
| Date | Buyer | Sale Price | Title Company |
|---|---|---|---|
| Charles Shyrley Elizabeth | $6,000 | -- | |
| Charles Anton C | $310,000 | First American Title | |
| Rusanova Galina | -- | None Available | |
| Rusanova Galina | $316,500 | Chicago Title Insurance Comp |
Source: Public Records
Mortgage History
| Date | Status | Borrower | Loan Amount |
|---|---|---|---|
| Previous Owner | Charles Anton C | $304,385 | |
| Previous Owner | Rusanova Galina | $225,250 |
Source: Public Records
Tax History Compared to Growth
Tax History
| Year | Tax Paid | Tax Assessment Tax Assessment Total Assessment is a certain percentage of the fair market value that is determined by local assessors to be the total taxable value of land and additions on the property. | Land | Improvement |
|---|---|---|---|---|
| 2024 | $11,636 | $125,769 | $29,847 | $95,922 |
| 2023 | $12,791 | $114,962 | $27,282 | $87,680 |
| 2022 | $12,791 | $113,026 | $27,817 | $85,209 |
| 2021 | $12,258 | $106,800 | $26,285 | $80,515 |
| 2020 | $11,909 | $101,791 | $25,052 | $76,739 |
| 2019 | $10,713 | $96,448 | $23,676 | $72,772 |
| 2018 | $10,321 | $98,408 | $31,947 | $66,461 |
| 2017 | $8,950 | $97,270 | $31,578 | $65,692 |
| 2016 | $8,906 | $92,111 | $29,903 | $62,208 |
| 2015 | $8,130 | $84,560 | $27,452 | $57,108 |
| 2014 | $9,122 | $78,993 | $26,788 | $52,205 |
| 2012 | $8,876 | $84,125 | $26,043 | $58,082 |
Source: Public Records
Map
Nearby Homes
- 2511 Bluewater Dr Unit 1A
- 2460 Savanna Dr
- 2810 Cattail Ct Unit B
- 2800 Cattail Ct Unit A
- 2227 Trailside Ln Unit 1B
- 2820 Glacier Way Unit B
- 2800 Sweet Clover Way
- 2490 Olivia Ct
- 2486 Olivia Ct
- 2472 Olivia Ct
- 2483 Olivia Ct
- 29650 N Garland Rd
- 2403 Goldenrod Way
- 2373 Heron Ln
- 24570 W Chardon Rd
- 29564 N Garland Rd
- 28722 N Madison Ave
- 28855 N Garland Rd
- 0 W Chardon Rd
- 29295 N Callahan Rd
- 2340 Fishhook Way
- 2336 Fishhook Way
- 2334 Fishhook Way Unit 1A
- 2359 Trailside Ln
- 2339 Fishhook Way Unit 1A
- 2341 Fishhook Way
- 2514 Bluewater Dr
- 2355 Trailside Ln Unit 1A
- 2337 Fishhook Way
- 2401 Trailside Ln Unit 1A
- 2351 Trailside Ln Unit 1A
- 2512 Bluewater Dr Unit 1A
- 2522 Bluewater Dr Unit 1A
- 2405 Trailside Ln Unit 1A
- 2347 Trailside Ln
- 2350 Fishhook Way
- 2519 Bluewater Dr
- 2517 Bluewater Dr
- 2521 Bluewater Dr Unit 1A
- 2510 Bluewater Dr