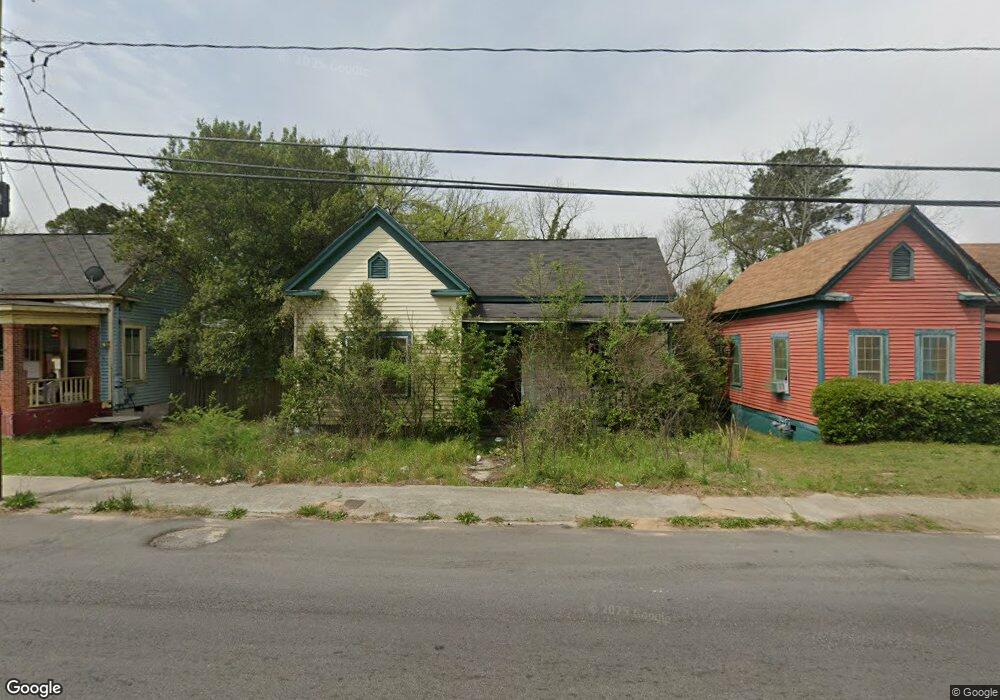
2339 2nd St Macon, GA 31206
Tindall Heights Historic District NeighborhoodEstimated Value: $49,000 - $74,697
2
Beds
1
Bath
1,374
Sq Ft
$45/Sq Ft
Est. Value
About This Home
This home is located at 2339 2nd St, Macon, GA 31206 and is currently estimated at $62,174, approximately $45 per square foot. 2339 2nd St is a home located in Bibb County with nearby schools including Ingram-Pye Elementary School, Central High School, and Cirrus Charter Academy.
Ownership History
Date
Name
Owned For
Owner Type
Purchase Details
Closed on
Aug 24, 2022
Sold by
Abu Sowe
Bought by
Host Me Llc
Current Estimated Value
Purchase Details
Closed on
May 24, 2018
Sold by
Barrie Brima
Bought by
Sowe Aby
Purchase Details
Closed on
Sep 19, 2010
Sold by
Sowe Abu
Bought by
Barrie Brima
Purchase Details
Closed on
Nov 20, 2007
Sold by
Hud
Bought by
Sowe Abu
Purchase Details
Closed on
Feb 7, 2006
Sold by
Georgia Housing And Finance Authority
Bought by
Secretary Of H U D
Purchase Details
Closed on
Aug 28, 1997
Create a Home Valuation Report for This Property
The Home Valuation Report is an in-depth analysis detailing your home's value as well as a comparison with similar homes in the area
Home Values in the Area
Average Home Value in this Area
Purchase History
| Date | Buyer | Sale Price | Title Company |
|---|---|---|---|
| Host Me Llc | $20,000 | -- | |
| Sowe Aby | -- | None Available | |
| Barrie Brima | -- | None Available | |
| Sowe Abu | $24,000 | None Available | |
| Secretary Of H U D | -- | None Avilebel | |
| Georgia Housing And Finance Authority | $30,675 | None Available | |
| -- | $37,500 | -- |
Source: Public Records
Tax History Compared to Growth
Tax History
| Year | Tax Paid | Tax Assessment Tax Assessment Total Assessment is a certain percentage of the fair market value that is determined by local assessors to be the total taxable value of land and additions on the property. | Land | Improvement |
|---|---|---|---|---|
| 2025 | $599 | $24,394 | $2,300 | $22,094 |
| 2024 | $620 | $24,394 | $2,300 | $22,094 |
| 2023 | $160 | $24,394 | $2,300 | $22,094 |
| 2022 | $226 | $8,805 | $1,797 | $7,008 |
| 2021 | $335 | $8,805 | $1,797 | $7,008 |
| 2020 | $342 | $8,805 | $1,797 | $7,008 |
| 2019 | $345 | $8,805 | $1,797 | $7,008 |
| 2018 | $708 | $8,805 | $1,797 | $7,008 |
| 2017 | $330 | $8,805 | $1,797 | $7,008 |
| 2016 | $499 | $14,411 | $1,797 | $12,614 |
| 2015 | $706 | $14,411 | $1,797 | $12,614 |
| 2014 | $812 | $14,411 | $1,797 | $12,614 |
Source: Public Records
Map
Nearby Homes