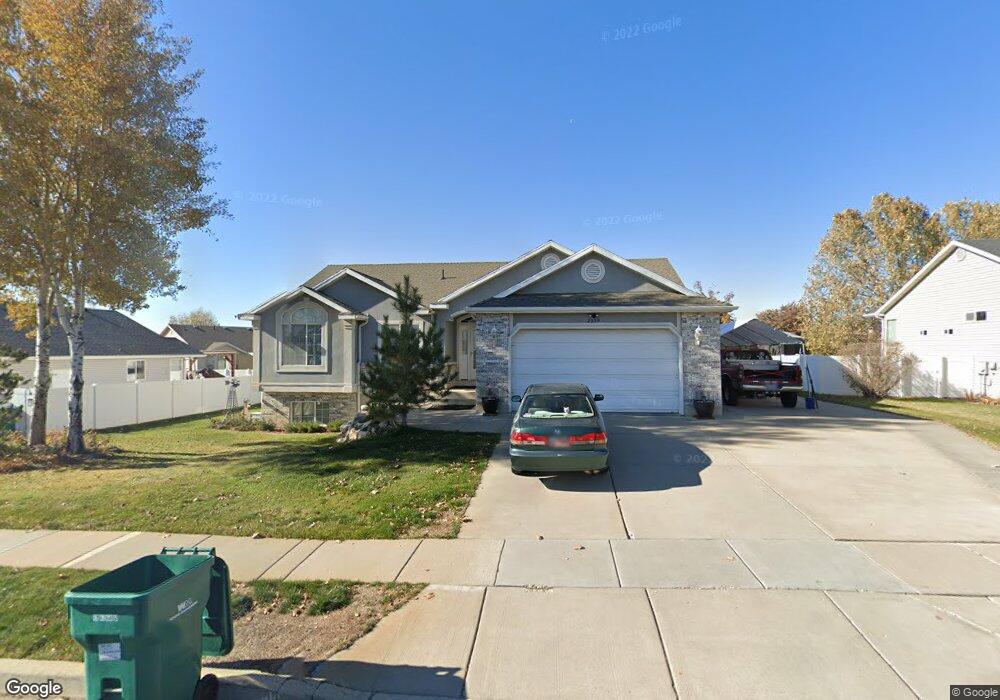
2339 N 75 E Unit 119 Layton, UT 84041
Estimated Value: $583,000 - $681,000
4
Beds
4
Baths
3,868
Sq Ft
$158/Sq Ft
Est. Value
About This Home
This home is located at 2339 N 75 E Unit 119, Layton, UT 84041 and is currently estimated at $611,298, approximately $158 per square foot. 2339 N 75 E Unit 119 is a home located in Davis County with nearby schools including Lincoln Elementary School, North Layton Junior High School, and Northridge High School.
Ownership History
Date
Name
Owned For
Owner Type
Purchase Details
Closed on
Oct 29, 2025
Sold by
Huffaker Patti A
Bought by
Powell Shirlef L
Current Estimated Value
Purchase Details
Closed on
Sep 26, 2006
Sold by
Powell Shirief L and Huffaker Patti A
Bought by
Powell Shirlef L and Huffaker Patti A
Home Financials for this Owner
Home Financials are based on the most recent Mortgage that was taken out on this home.
Original Mortgage
$132,000
Interest Rate
6.18%
Mortgage Type
New Conventional
Purchase Details
Closed on
Jan 21, 2003
Sold by
Glen Haney Carpentry Inc
Bought by
Powell Shirlef L and Huffaker Patti A
Home Financials for this Owner
Home Financials are based on the most recent Mortgage that was taken out on this home.
Original Mortgage
$105,000
Interest Rate
5.39%
Purchase Details
Closed on
Sep 19, 2002
Sold by
Antelope Ridge Inc
Bought by
Glen Haney Carpentry Inc
Home Financials for this Owner
Home Financials are based on the most recent Mortgage that was taken out on this home.
Original Mortgage
$137,500
Interest Rate
5.99%
Create a Home Valuation Report for This Property
The Home Valuation Report is an in-depth analysis detailing your home's value as well as a comparison with similar homes in the area
Home Values in the Area
Average Home Value in this Area
Purchase History
| Date | Buyer | Sale Price | Title Company |
|---|---|---|---|
| Powell Shirlef L | -- | None Listed On Document | |
| Powell Shirlef L | -- | Equity Title Ins Agency | |
| Powell Shirlef L | -- | First American Title Co | |
| Glen Haney Carpentry Inc | -- | First American Title Co |
Source: Public Records
Mortgage History
| Date | Status | Borrower | Loan Amount |
|---|---|---|---|
| Previous Owner | Powell Shirlef L | $132,000 | |
| Previous Owner | Powell Shirlef L | $105,000 | |
| Previous Owner | Glen Haney Carpentry Inc | $137,500 |
Source: Public Records
Tax History
| Year | Tax Paid | Tax Assessment Tax Assessment Total Assessment is a certain percentage of the fair market value that is determined by local assessors to be the total taxable value of land and additions on the property. | Land | Improvement |
|---|---|---|---|---|
| 2025 | $3,157 | $299,750 | $109,008 | $190,742 |
| 2024 | $2,978 | $285,999 | $126,583 | $159,416 |
| 2023 | $3,040 | $286,550 | $80,590 | $205,959 |
| 2022 | $3,279 | $561,000 | $142,994 | $418,006 |
| 2021 | $3,028 | $424,000 | $113,494 | $310,506 |
| 2020 | $2,770 | $371,000 | $94,152 | $276,848 |
| 2019 | $2,670 | $352,000 | $88,215 | $263,785 |
| 2018 | $2,477 | $327,000 | $88,215 | $238,785 |
| 2016 | $2,243 | $155,760 | $29,049 | $126,711 |
| 2015 | $2,269 | $150,315 | $29,049 | $121,266 |
| 2014 | $2,187 | $148,552 | $29,049 | $119,503 |
| 2013 | -- | $125,631 | $31,020 | $94,611 |
Source: Public Records
Map
Nearby Homes
- 2311 N 10 W
- 2500 N Fort Ln Unit 212
- 2500 N Fort Ln Unit 244
- 12 E 2150 N
- 2600 N Hill Field Rd Unit 134
- 2600 N Hill Field Rd Unit 86
- 2600 N Hill Field Rd Unit 71
- 265 Mindella Way
- 2504 N Knights Ln
- 414 E 2625 N
- 269 Mindella Way Unit A
- 14 Lakeview Dr
- 241 Fremont Way
- 215 Engstrom Way
- 311 Harriger Way
- 2214 N 450 W
- 202 Darlington Way
- 1908 N 200 W
- 1857 N 50 W
- 58 Sunset Dr
Your Personal Tour Guide
Ask me questions while you tour the home.