Estimated Value: $396,000 - $553,000
3
Beds
1
Bath
996
Sq Ft
$485/Sq Ft
Est. Value
About This Home
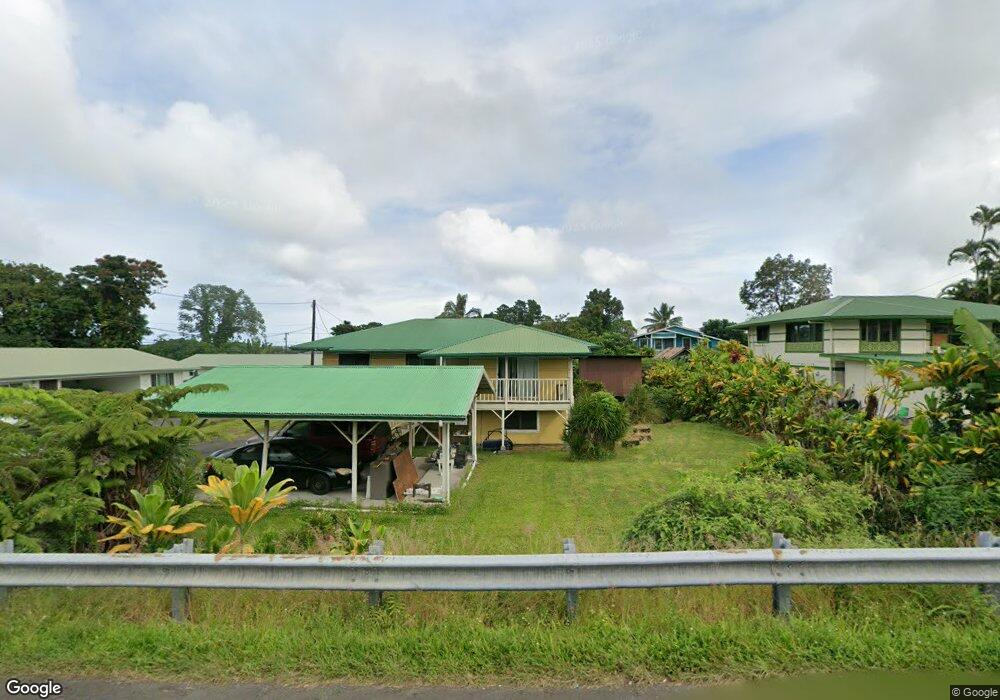
This home is located at 2339B Kinoole St, Hilo, HI 96720 and is currently estimated at $482,621, approximately $484 per square foot. 2339B Kinoole St is a home located in Hawaii County with nearby schools including Waiakeawaena Elementary School, Waiakea Intermediate School, and Waiakea High School.
Ownership History
Date
Name
Owned For
Owner Type
Purchase Details
Closed on
Jul 9, 2007
Sold by
Kamahele William
Bought by
De Sa Roslyn and The William K Kamahele Irrevocable Trust
Current Estimated Value
Purchase Details
Closed on
Jun 19, 2006
Sold by
Baptiste Denis D and Baptiste Roseline S
Bought by
Grigg Lorene B and Grigg Rosemarie E
Purchase Details
Closed on
Oct 31, 2000
Sold by
Desa Roslyn I and Nehls Roslyn I
Bought by
Kamahele William
Purchase Details
Closed on
Jan 27, 2000
Sold by
Desa Roslyn
Bought by
Kamahele William
Purchase Details
Closed on
Oct 11, 1995
Sold by
Kamahele Samuel K and Kamahele Cecelia K
Bought by
Kaapuni Kamahele Samuel Koloka and Kaapuni Kamahele Cecelia Kawahine
Create a Home Valuation Report for This Property
The Home Valuation Report is an in-depth analysis detailing your home's value as well as a comparison with similar homes in the area
Home Values in the Area
Average Home Value in this Area
Purchase History
| Date | Buyer | Sale Price | Title Company |
|---|---|---|---|
| De Sa Roslyn | -- | None Available | |
| Grigg Lorene B | -- | None Available | |
| Kamahele William | -- | Island Title Corp | |
| Kamahele William | -- | Island Title Corp | |
| Kaapuni Kamahele Samuel Koloka | -- | -- |
Source: Public Records
Tax History
| Year | Tax Paid | Tax Assessment Tax Assessment Total Assessment is a certain percentage of the fair market value that is determined by local assessors to be the total taxable value of land and additions on the property. | Land | Improvement |
|---|---|---|---|---|
| 2025 | $200 | $181,200 | $54,500 | $126,700 |
| 2024 | $200 | $175,900 | $54,500 | $121,400 |
| 2023 | $200 | $170,800 | $54,500 | $116,300 |
| 2022 | $200 | $165,800 | $54,500 | $111,300 |
| 2021 | $200 | $161,000 | $54,500 | $106,500 |
| 2020 | $200 | $156,300 | $54,500 | $101,800 |
| 2019 | $200 | $151,700 | $54,500 | $97,200 |
| 2018 | $200 | $147,300 | $54,500 | $92,800 |
| 2017 | $200 | $143,000 | $54,500 | $88,500 |
| 2016 | $100 | $138,800 | $54,500 | $84,300 |
Source: Public Records
Map
Nearby Homes
- 2501 Kilauea Ave
- 2244 Kinoole St
- 75 E Palai St
- 89 W Kawailani St
- 2501 Kinoole St
- 2669 Kilauea Ave
- 126 W Kinai Place
- 3047 Lou St
- 51 Ahona Place
- 2557 Kinoole St
- 347 Nohea St
- 91 Kamalii St
- 2059 Kinoole St
- 2615 Kinoole St
- 199 Kehaulani St Unit 3
- 74 Maikai St
- 346 Kanoelani St
- 39 Laula Rd
- 450 Pohakulani St
- 508 Ekela St
- 2339 Kinoole St
- 2520 Kilauea Ave
- 2345A Kinoole St
- 2333 Kinoole St
- 2325 Kinoole St
- 2506 Kilauea Ave
- 2353 Kinoole St
- 30 W Palai St
- 38 W Palai St
- 2500A Kilauea Ave
- 2530 Kilauea Ave
- 2332A Kinoole St
- 2536 Kilauea Ave
- 2307 Kinoole St
- 20 W Palai St
- 42 W Palai St
- 2542 Kilauea Ave
- 2322 Kinoole St
- 2534 Kilauea Ave
- 2340 Kinoole St
Your Personal Tour Guide
Ask me questions while you tour the home.