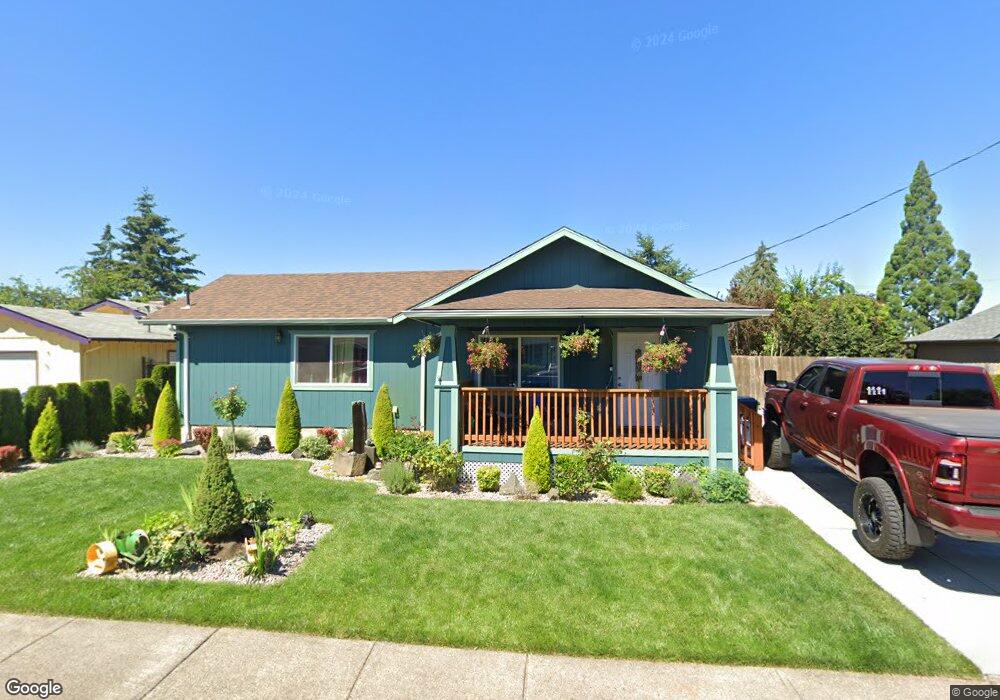
234 37th St Springfield, OR 97478
East Springfield NeighborhoodEstimated Value: $351,000 - $373,000
1
Bed
1
Bath
640
Sq Ft
$572/Sq Ft
Est. Value
About This Home
This home is located at 234 37th St, Springfield, OR 97478 and is currently estimated at $365,982, approximately $571 per square foot. 234 37th St is a home located in Lane County with nearby schools including Riverbend Elementary School, Briggs Middle School, and Thurston High School.
Ownership History
Date
Name
Owned For
Owner Type
Purchase Details
Closed on
Jul 31, 2019
Sold by
Carlos Dulce Maria
Bought by
Vega Jose Mejia and Castillo Maria D Aguilar
Current Estimated Value
Home Financials for this Owner
Home Financials are based on the most recent Mortgage that was taken out on this home.
Original Mortgage
$100,000
Outstanding Balance
$65,096
Interest Rate
3.8%
Mortgage Type
Purchase Money Mortgage
Estimated Equity
$300,886
Purchase Details
Closed on
Aug 21, 2012
Sold by
Franklin Patricia
Bought by
Delgado Guadalupe Carlos
Create a Home Valuation Report for This Property
The Home Valuation Report is an in-depth analysis detailing your home's value as well as a comparison with similar homes in the area
Home Values in the Area
Average Home Value in this Area
Purchase History
| Date | Buyer | Sale Price | Title Company |
|---|---|---|---|
| Vega Jose Mejia | $165,000 | Cascade Title Co | |
| Delgado Guadalupe Carlos | $30,000 | Cascade Title Company |
Source: Public Records
Mortgage History
| Date | Status | Borrower | Loan Amount |
|---|---|---|---|
| Open | Vega Jose Mejia | $100,000 |
Source: Public Records
Tax History
| Year | Tax Paid | Tax Assessment Tax Assessment Total Assessment is a certain percentage of the fair market value that is determined by local assessors to be the total taxable value of land and additions on the property. | Land | Improvement |
|---|---|---|---|---|
| 2025 | $2,544 | $138,718 | -- | -- |
| 2024 | $2,503 | $134,678 | -- | -- |
| 2023 | $2,503 | $130,756 | $0 | $0 |
| 2022 | $2,318 | $126,948 | $0 | $0 |
| 2021 | $1,455 | $78,807 | $0 | $0 |
| 2020 | $1,413 | $76,512 | $0 | $0 |
| 2019 | $1,370 | $74,284 | $0 | $0 |
| 2018 | $1,292 | $70,020 | $0 | $0 |
| 2017 | $1,242 | $70,020 | $0 | $0 |
| 2016 | $1,216 | $67,981 | $0 | $0 |
| 2015 | $1,328 | $74,169 | $0 | $0 |
| 2014 | $1,308 | $72,009 | $0 | $0 |
Source: Public Records
Map
Nearby Homes