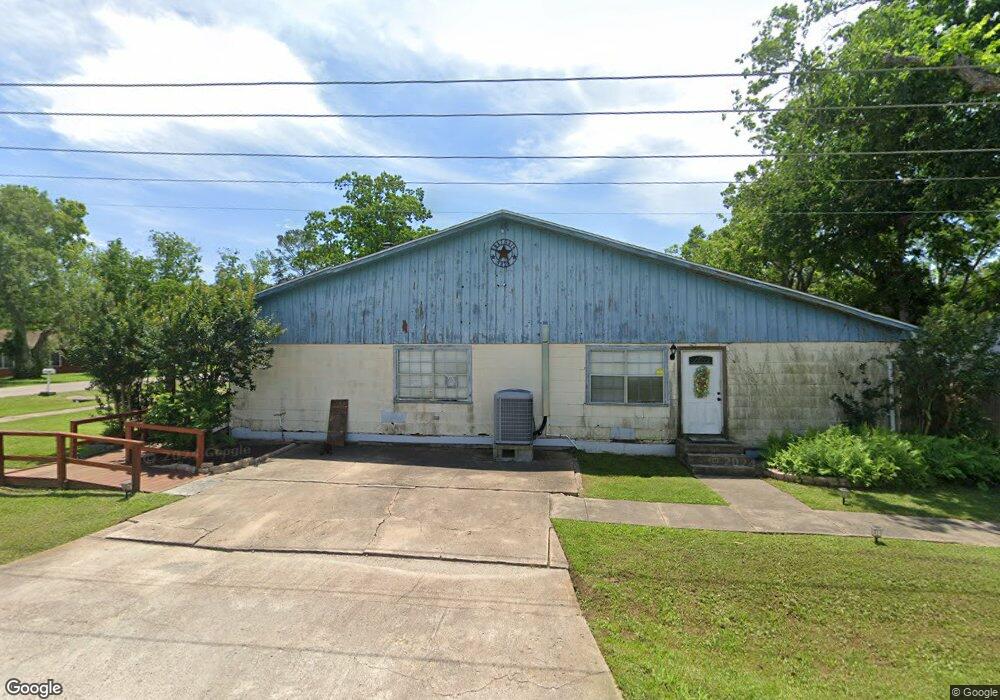
234 4th St Brazoria, TX 77422
Estimated Value: $203,000 - $220,000
5
Beds
3
Baths
2,220
Sq Ft
$95/Sq Ft
Est. Value
About This Home
This home is located at 234 4th St, Brazoria, TX 77422 and is currently estimated at $210,834, approximately $94 per square foot. 234 4th St is a home located in Brazoria County.
Ownership History
Date
Name
Owned For
Owner Type
Purchase Details
Closed on
Mar 23, 2004
Sold by
Swinscoe Sharon and Swinscoe Larry E
Bought by
Bair Jeremy Lance and Bair Bobbie Jo
Current Estimated Value
Home Financials for this Owner
Home Financials are based on the most recent Mortgage that was taken out on this home.
Original Mortgage
$92,419
Outstanding Balance
$42,950
Interest Rate
5.59%
Mortgage Type
FHA
Estimated Equity
$167,884
Purchase Details
Closed on
May 20, 1994
Sold by
Cisneros Henry G
Bought by
Case Rodney M and Case Sherry A
Purchase Details
Closed on
Oct 7, 1993
Sold by
Bancplus Mtg Corp
Bought by
Hud
Create a Home Valuation Report for This Property
The Home Valuation Report is an in-depth analysis detailing your home's value as well as a comparison with similar homes in the area
Home Values in the Area
Average Home Value in this Area
Purchase History
| Date | Buyer | Sale Price | Title Company |
|---|---|---|---|
| Bair Jeremy Lance | -- | American Title Co | |
| Case Rodney M | -- | Houston Title Company 507 | |
| Hud | -- | Title Agency #26 |
Source: Public Records
Mortgage History
| Date | Status | Borrower | Loan Amount |
|---|---|---|---|
| Open | Bair Jeremy Lance | $92,419 |
Source: Public Records
Tax History Compared to Growth
Tax History
| Year | Tax Paid | Tax Assessment Tax Assessment Total Assessment is a certain percentage of the fair market value that is determined by local assessors to be the total taxable value of land and additions on the property. | Land | Improvement |
|---|---|---|---|---|
| 2025 | $2,210 | $172,580 | $28,460 | $144,120 |
| 2023 | $2,210 | $156,586 | $25,920 | $261,900 |
| 2022 | $3,215 | $142,351 | $22,870 | $155,990 |
| 2021 | $3,050 | $129,410 | $19,820 | $109,590 |
| 2020 | $3,248 | $139,800 | $18,300 | $121,500 |
| 2019 | $3,047 | $139,770 | $11,010 | $128,760 |
| 2018 | $2,785 | $108,510 | $13,210 | $95,300 |
| 2017 | $3,540 | $151,570 | $13,210 | $138,360 |
| 2016 | $3,219 | $129,810 | $11,010 | $118,800 |
| 2015 | $2,340 | $110,230 | $11,010 | $99,220 |
| 2014 | $2,340 | $105,070 | $11,010 | $94,060 |
Source: Public Records
Map
Nearby Homes