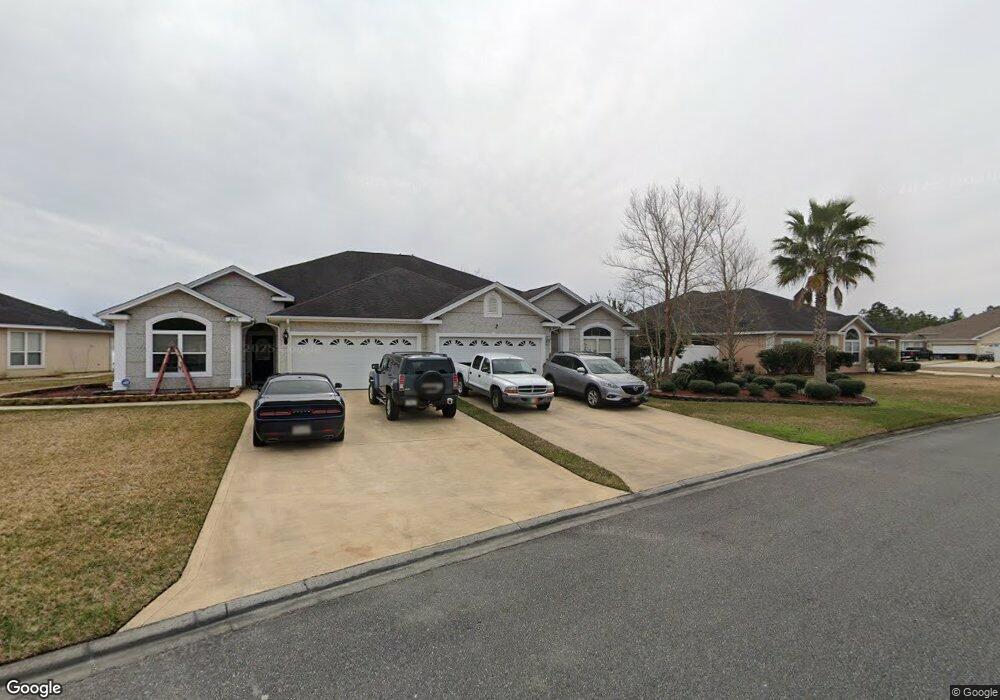
234 Austin Ryan Dr Kingsland, GA 31548
Estimated Value: $293,000 - $328,000
3
Beds
2
Baths
1,854
Sq Ft
$166/Sq Ft
Est. Value
About This Home
This home is located at 234 Austin Ryan Dr, Kingsland, GA 31548 and is currently estimated at $307,419, approximately $165 per square foot. 234 Austin Ryan Dr is a home located in Camden County with nearby schools including Sugarmill Elementary School, Saint Marys Middle School, and Camden County High School.
Ownership History
Date
Name
Owned For
Owner Type
Purchase Details
Closed on
Mar 30, 2017
Sold by
Minckler Laurie
Bought by
Hubbard Victor D and Huddbard Maureen C
Current Estimated Value
Home Financials for this Owner
Home Financials are based on the most recent Mortgage that was taken out on this home.
Original Mortgage
$144,000
Outstanding Balance
$119,467
Interest Rate
4.1%
Mortgage Type
New Conventional
Estimated Equity
$187,952
Purchase Details
Closed on
Nov 12, 2014
Sold by
Federal National Mortgage Association
Bought by
Minckler Laurie
Home Financials for this Owner
Home Financials are based on the most recent Mortgage that was taken out on this home.
Original Mortgage
$95,920
Interest Rate
4%
Mortgage Type
New Conventional
Purchase Details
Closed on
Oct 1, 2013
Sold by
Reverse Mtg Solutions Inc
Bought by
Federal National Mtg Associati
Create a Home Valuation Report for This Property
The Home Valuation Report is an in-depth analysis detailing your home's value as well as a comparison with similar homes in the area
Home Values in the Area
Average Home Value in this Area
Purchase History
| Date | Buyer | Sale Price | Title Company |
|---|---|---|---|
| Hubbard Victor D | $182,000 | -- | |
| Minckler Laurie | $119,900 | -- | |
| Federal National Mtg Associati | $150,000 | -- | |
| Reverse Mtg Solutions Inc | $150,000 | -- |
Source: Public Records
Mortgage History
| Date | Status | Borrower | Loan Amount |
|---|---|---|---|
| Open | Hubbard Victor D | $144,000 | |
| Previous Owner | Minckler Laurie | $95,920 |
Source: Public Records
Tax History Compared to Growth
Tax History
| Year | Tax Paid | Tax Assessment Tax Assessment Total Assessment is a certain percentage of the fair market value that is determined by local assessors to be the total taxable value of land and additions on the property. | Land | Improvement |
|---|---|---|---|---|
| 2024 | $1,798 | $104,870 | $5,000 | $99,870 |
| 2023 | $1,879 | $104,870 | $5,000 | $99,870 |
| 2022 | $1,605 | $88,376 | $5,000 | $83,376 |
| 2021 | $1,653 | $77,930 | $5,000 | $72,930 |
| 2020 | $1,667 | $71,266 | $5,000 | $66,266 |
| 2019 | $1,667 | $71,266 | $5,000 | $66,266 |
| 2018 | $377 | $71,266 | $5,000 | $66,266 |
| 2017 | $2,529 | $65,554 | $5,000 | $60,554 |
| 2016 | $1,908 | $63,713 | $5,000 | $58,713 |
| 2015 | $1,774 | $63,713 | $5,000 | $58,713 |
| 2014 | $2,024 | $54,906 | $5,000 | $49,906 |
Source: Public Records
Map
Nearby Homes
- 215 Austin Ryan Dr
- 199 Austin Ryan Dr
- 204 Laurel Landing Blvd
- 121 Kathryne Bailey Dr
- 115 Meridian Dr
- 103 Renee Dr
- 259 Laurel Landing Blvd
- 89 Amanda Trace
- 79 Spyglass
- 206 Miller Dr
- 107 Amanda Trc
- 102 Herons Nest Cir
- 326 Daniel Trent Way
- 102 Thomas Ct
- 124 Cedar Circle Dr
- 126 Amanda Trc
- 125 Fiddlers Cove Dr
- 126 Amanda Trace
- 107 Kerstin Ct
- 121 Amanda Trace
- 236 Austin Ryan Dr
- 232 Austin Ryan Dr
- 136 Austin Ryan Dr
- 134 Austin Ryan Dr
- 230 Austin Ryan Dr
- 239 Austin Ryan Dr
- 138 Austin Ryan Dr
- 218 Austin Ryan Dr
- 132 Austin Ryan Dr
- 216 Austin Ryan Dr
- 140 Austin Ryan Dr
- 237 Austin Ryan Dr
- 214 Austin Ryan Dr
- 130 Austin Ryan Dr
- 142 Austin Ryan Dr
- 142 Austin Ryan Dr Unit A
- 0 Austin Ryan Dr
- 123 Austin Ryan Dr
- 125 Austin Ryan Dr Unit 7
- 125 Austin Ryan Dr