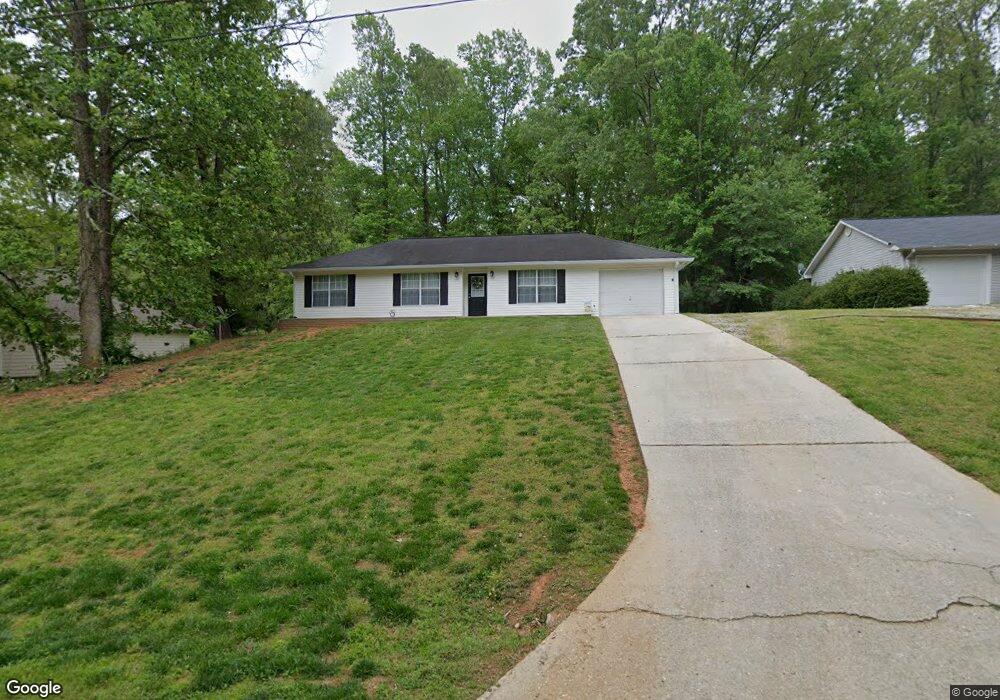
234 Chestnut Ave Demorest, GA 30535
Estimated Value: $252,000 - $276,000
3
Beds
2
Baths
1,188
Sq Ft
$223/Sq Ft
Est. Value
About This Home
This home is located at 234 Chestnut Ave, Demorest, GA 30535 and is currently estimated at $264,464, approximately $222 per square foot. 234 Chestnut Ave is a home located in Habersham County with nearby schools including Demorest Elementary School, Wilbanks Middle School, and Habersham Success Academy.
Ownership History
Date
Name
Owned For
Owner Type
Purchase Details
Closed on
Aug 3, 2020
Sold by
Sullivan Cynthia
Bought by
Bellamy Cynthia and Bellamy Jacob
Current Estimated Value
Home Financials for this Owner
Home Financials are based on the most recent Mortgage that was taken out on this home.
Original Mortgage
$122,000
Outstanding Balance
$108,223
Interest Rate
3%
Mortgage Type
New Conventional
Estimated Equity
$156,241
Purchase Details
Closed on
Jun 7, 2018
Sold by
Atwood William Scott
Bought by
Sullivan Cynthia
Home Financials for this Owner
Home Financials are based on the most recent Mortgage that was taken out on this home.
Original Mortgage
$120,175
Interest Rate
4.5%
Mortgage Type
New Conventional
Purchase Details
Closed on
Jun 30, 2010
Sold by
Venita
Bought by
Atwood William Scott
Home Financials for this Owner
Home Financials are based on the most recent Mortgage that was taken out on this home.
Original Mortgage
$87,817
Interest Rate
4.5%
Mortgage Type
FHA
Create a Home Valuation Report for This Property
The Home Valuation Report is an in-depth analysis detailing your home's value as well as a comparison with similar homes in the area
Home Values in the Area
Average Home Value in this Area
Purchase History
| Date | Buyer | Sale Price | Title Company |
|---|---|---|---|
| Bellamy Cynthia | -- | -- | |
| Sullivan Cynthia | $126,500 | -- | |
| Atwood William Scott | $89,000 | -- |
Source: Public Records
Mortgage History
| Date | Status | Borrower | Loan Amount |
|---|---|---|---|
| Open | Bellamy Cynthia | $122,000 | |
| Previous Owner | Sullivan Cynthia | $120,175 | |
| Previous Owner | Atwood William Scott | $87,817 |
Source: Public Records
Tax History
| Year | Tax Paid | Tax Assessment Tax Assessment Total Assessment is a certain percentage of the fair market value that is determined by local assessors to be the total taxable value of land and additions on the property. | Land | Improvement |
|---|---|---|---|---|
| 2025 | $2,551 | $89,364 | $10,388 | $78,976 |
| 2024 | -- | $76,444 | $7,352 | $69,092 |
| 2023 | $1,182 | $65,780 | $8,820 | $56,960 |
| 2022 | $1,404 | $55,772 | $7,056 | $48,716 |
| 2021 | $1,242 | $49,780 | $6,352 | $43,428 |
| 2020 | $1,143 | $42,496 | $5,292 | $37,204 |
| 2019 | $1,144 | $42,496 | $5,292 | $37,204 |
| 2018 | $949 | $37,436 | $4,412 | $33,024 |
| 2017 | $834 | $32,968 | $3,528 | $29,440 |
| 2016 | $808 | $82,420 | $3,528 | $29,440 |
| 2015 | $798 | $82,420 | $3,528 | $29,440 |
| 2014 | $790 | $80,270 | $3,528 | $28,580 |
| 2013 | -- | $32,108 | $3,528 | $28,580 |
Source: Public Records
Map
Nearby Homes
- 226 Chestnut Ave
- 159 Hardyville Cir
- 515 Wauka Dr
- 539 Wauka Dr
- 545 Wauka Dr
- 314 Holley St
- 451 Spiral Hills Dr
- 274 & 278 N Hazel Ave
- 660 Bald Ridge Cir
- 668 Bald Ridge Cir
- 623 Maine St
- 150 Kentucky Dr Unit A&B
- 101 Long St
- 4444 State Highway 365
- 114 Springbrook Dr
- 180 Springbrook Dr
- 151 Ivy St
- 834 Hancock Rd
- 1562 Central Ave
- 308 Parthenia Dr
- 234 Chestnut Ave Unit 1
- 240 Chestnut Ave
- 218 Chestnut Ave
- 317 Chestnut Ave
- 197 Piedmont College Cir
- 255 Piedmont College Cir
- 251 Piedmont College Cir
- 225 Piedmont College Cir
- 210 Chestnut Ave Unit 4
- 210 Chestnut Ave
- 315 Chestnut Ave
- 163 Piedmont College Cir
- 319 Chestnut Ave Unit 315 D
- 319 Chestnut Ave Unit A
- 319 Chestnut Ave Unit 315 A
- 319 Chestnut Ave Unit F
- 319 Chestnut Ave Unit 315 F
- 319 Chestnut Ave Unit C
- 319 Chestnut Ave Unit 315 C
- 319 Chestnut Ave
Your Personal Tour Guide
Ask me questions while you tour the home.