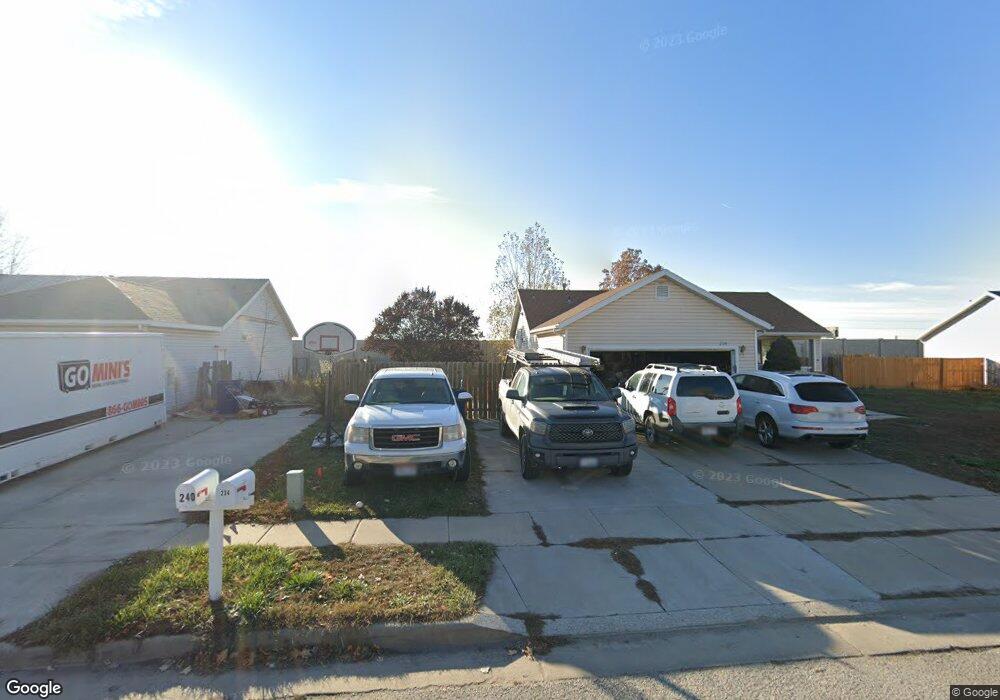
234 Christine Way Kaysville, UT 84037
Estimated Value: $415,000 - $462,000
3
Beds
2
Baths
1,191
Sq Ft
$372/Sq Ft
Est. Value
About This Home
This home is located at 234 Christine Way, Kaysville, UT 84037 and is currently estimated at $442,913, approximately $371 per square foot. 234 Christine Way is a home located in Davis County with nearby schools including Columbia Elementary School, Kaysville Junior High School, and Davis High School.
Ownership History
Date
Name
Owned For
Owner Type
Purchase Details
Closed on
Nov 12, 2014
Sold by
Talbot Brandon B
Bought by
Talbot Brandon B and Talbot Rachel J
Current Estimated Value
Home Financials for this Owner
Home Financials are based on the most recent Mortgage that was taken out on this home.
Original Mortgage
$146,200
Outstanding Balance
$81,426
Interest Rate
4.16%
Mortgage Type
New Conventional
Estimated Equity
$361,487
Purchase Details
Closed on
May 18, 2005
Sold by
Webster J Blake
Bought by
Talbot Brandon B
Home Financials for this Owner
Home Financials are based on the most recent Mortgage that was taken out on this home.
Original Mortgage
$129,960
Interest Rate
5.74%
Mortgage Type
FHA
Purchase Details
Closed on
Aug 31, 2004
Sold by
Hinckley E Michael and Hinckley Angela S
Bought by
Webster J Blake
Home Financials for this Owner
Home Financials are based on the most recent Mortgage that was taken out on this home.
Original Mortgage
$101,600
Interest Rate
5.25%
Mortgage Type
Purchase Money Mortgage
Create a Home Valuation Report for This Property
The Home Valuation Report is an in-depth analysis detailing your home's value as well as a comparison with similar homes in the area
Home Values in the Area
Average Home Value in this Area
Purchase History
| Date | Buyer | Sale Price | Title Company |
|---|---|---|---|
| Talbot Brandon B | -- | Metro National Title | |
| Talbot Brandon B | -- | Backman Stewart Title Svcs | |
| Webster J Blake | -- | Backman Stewart Title Svcs |
Source: Public Records
Mortgage History
| Date | Status | Borrower | Loan Amount |
|---|---|---|---|
| Open | Talbot Brandon B | $146,200 | |
| Closed | Talbot Brandon B | $129,960 | |
| Previous Owner | Webster J Blake | $101,600 | |
| Closed | Webster J Blake | $12,700 |
Source: Public Records
Tax History Compared to Growth
Tax History
| Year | Tax Paid | Tax Assessment Tax Assessment Total Assessment is a certain percentage of the fair market value that is determined by local assessors to be the total taxable value of land and additions on the property. | Land | Improvement |
|---|---|---|---|---|
| 2025 | $2,029 | $216,701 | $153,698 | $63,003 |
| 2024 | $2,029 | $213,950 | $154,384 | $59,566 |
| 2023 | $1,998 | $373,000 | $270,082 | $102,918 |
| 2022 | $2,016 | $211,200 | $126,489 | $84,711 |
| 2021 | $1,834 | $288,000 | $177,071 | $110,929 |
| 2020 | $1,628 | $249,000 | $127,694 | $121,306 |
| 2019 | $1,618 | $243,000 | $107,204 | $135,796 |
| 2018 | $1,470 | $220,000 | $97,458 | $122,542 |
| 2016 | $1,322 | $104,005 | $32,325 | $71,680 |
| 2015 | $1,207 | $90,200 | $32,325 | $57,875 |
| 2014 | -- | $86,910 | $32,325 | $54,585 |
| 2013 | -- | $82,307 | $22,966 | $59,341 |
Source: Public Records
Map
Nearby Homes
- 203 S Larkin Ln
- 300 S Larkin Ln
- 75 S Grandison Ct E Unit 69-R
- 86 S Grandison Ct E Unit 79-R
- 127 S Rock Loft Ridge Dr Unit 57-R
- 159 S Rock Loft Ridge Dr Unit 59-R
- 1346 W Blackbird Ln Unit 3
- 209 N Rock Loft Ridge E Unit 32-R
- 198 S Rock Loft Ridge Dr E Unit 6-R
- 246 N Rock Loft Ridge Dr Unit 36-R
- 167 S Grandison E Unit 74-R
- 109 S Rock Loft Ridge Dr Unit 56-R
- 93 S Rock Loft Ridge Dr Unit 55-R
- 34 S Rock Loft Ridge Dr Unit 85-R
- 52 S Grandison Ct E Unit 83-R
- 190 N Rock Loft Ridge Dr Unit 40-R
- 96 S Rock Loft Ridge Dr Unit 12-R
- 28 N Rock Loft Ridge Dr Unit 46-R
- 22 S Rock Loft Ridge Dr Unit 16-R
- 67 S Rock Loft Ridge Dr Unit 53-R
- 240 Christine Way
- 230 Christine Way
- 248 Christine Way
- 224 Christine Way
- 241 Christine Way
- 396 Spring Haven Ct
- 256 Christine Way
- 245 Christine Way
- 220 Christine Way
- 231 Christine Way
- 257 Christine Way
- 80 S 400 W Unit 2
- 65 S 400 W Unit 1
- 65 S 400 W
- 80 S 400 W
- 227 Christine Way
- 264 Christine Way
- 378 Spring Haven Ct
- 371 W Spring Haven Ct
- 216 Christine Way