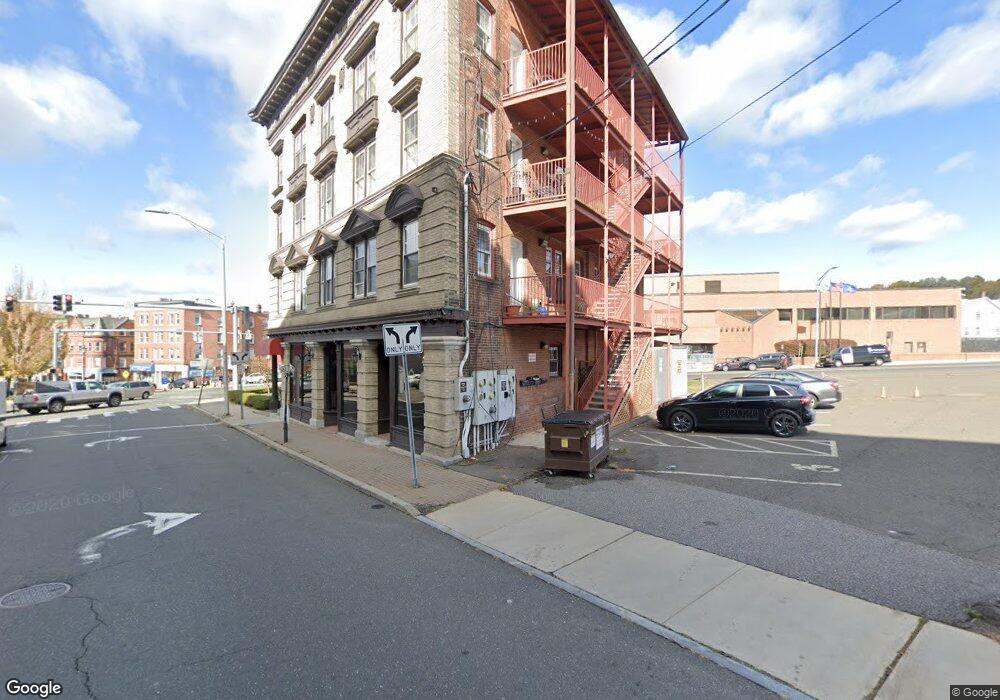
234 E Main St Waterbury, CT 06702
Village of Waterbury NeighborhoodEstimated Value: $772,907
Studio
1
Bath
10,008
Sq Ft
$77/Sq Ft
Est. Value
About This Home
This home is located at 234 E Main St, Waterbury, CT 06702 and is currently estimated at $772,907, approximately $77 per square foot. 234 E Main St is a home located in New Haven County with nearby schools including H.S. Chase School, West Side Middle School, and John F. Kennedy High School.
Ownership History
Date
Name
Owned For
Owner Type
Purchase Details
Closed on
Jun 20, 2023
Sold by
A C Martin Llc
Bought by
Once Llc
Current Estimated Value
Home Financials for this Owner
Home Financials are based on the most recent Mortgage that was taken out on this home.
Original Mortgage
$455,000
Outstanding Balance
$440,775
Interest Rate
6.35%
Mortgage Type
Purchase Money Mortgage
Estimated Equity
$332,132
Purchase Details
Closed on
Jun 30, 1999
Sold by
Farrell Caroline M Est and Botticello
Bought by
Carriage Svcs Of Ct
Create a Home Valuation Report for This Property
The Home Valuation Report is an in-depth analysis detailing your home's value as well as a comparison with similar homes in the area
Home Values in the Area
Average Home Value in this Area
Purchase History
| Date | Buyer | Sale Price | Title Company |
|---|---|---|---|
| Once Llc | $650,000 | None Available | |
| Carriage Svcs Of Ct | $176,041 | -- | |
| Carriage Svcs Of Ct | $148,958 | -- |
Source: Public Records
Mortgage History
| Date | Status | Borrower | Loan Amount |
|---|---|---|---|
| Open | Once Llc | $455,000 | |
| Previous Owner | Carriage Svcs Of Ct | $100,000 | |
| Previous Owner | Carriage Svcs Of Ct | $75,000 |
Source: Public Records
Tax History
| Year | Tax Paid | Tax Assessment Tax Assessment Total Assessment is a certain percentage of the fair market value that is determined by local assessors to be the total taxable value of land and additions on the property. | Land | Improvement |
|---|---|---|---|---|
| 2025 | $16,864 | $374,920 | $79,240 | $295,680 |
| 2024 | $18,536 | $374,920 | $79,240 | $295,680 |
| 2023 | $20,317 | $374,920 | $79,240 | $295,680 |
| 2022 | $16,568 | $275,170 | $79,250 | $195,920 |
| 2021 | $16,568 | $275,170 | $79,250 | $195,920 |
| 2020 | $16,568 | $275,170 | $79,250 | $195,920 |
| 2019 | $16,568 | $275,170 | $79,250 | $195,920 |
| 2018 | $16,568 | $275,170 | $79,250 | $195,920 |
| 2017 | $16,531 | $274,560 | $79,250 | $195,310 |
| 2016 | $16,531 | $274,560 | $79,250 | $195,310 |
| 2015 | $15,985 | $274,560 | $79,250 | $195,310 |
| 2014 | $15,985 | $274,560 | $79,250 | $195,310 |
Source: Public Records
Map
Nearby Homes
Your Personal Tour Guide
Ask me questions while you tour the home.