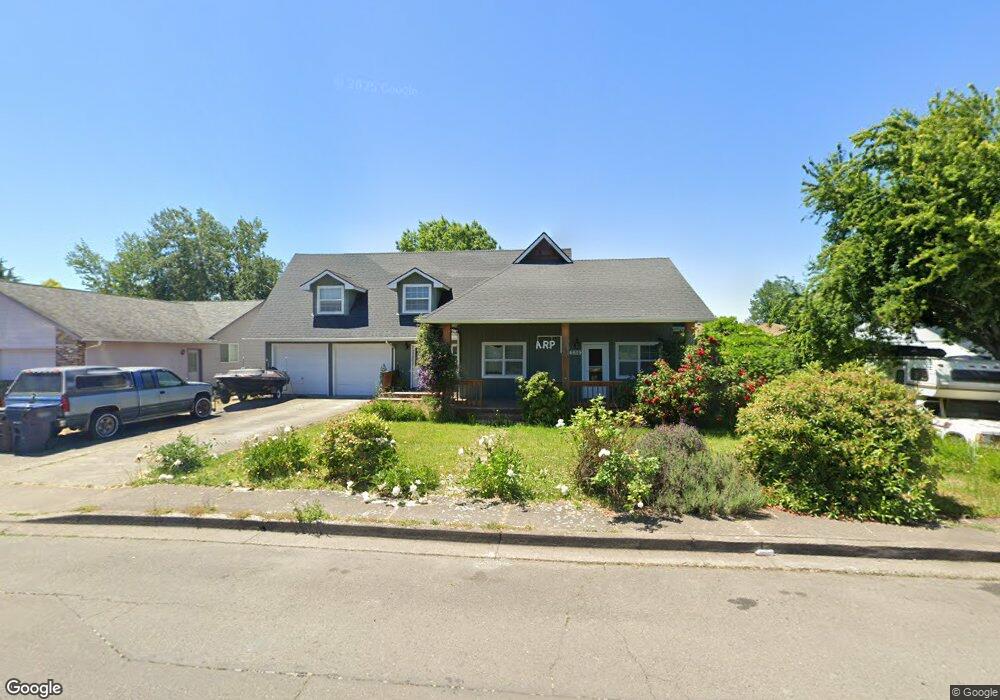
234 Edwards Rd Monmouth, OR 97361
Estimated Value: $417,000 - $503,000
3
Beds
2
Baths
2,278
Sq Ft
$205/Sq Ft
Est. Value
About This Home
This home is located at 234 Edwards Rd, Monmouth, OR 97361 and is currently estimated at $466,886, approximately $204 per square foot. 234 Edwards Rd is a home located in Polk County with nearby schools including Ash Creek Elementary School, Talmadge Middle School, and Central High School.
Ownership History
Date
Name
Owned For
Owner Type
Purchase Details
Closed on
Oct 25, 2021
Sold by
Arp Garson T and Arp Catherine A
Bought by
Arp Garson T and Arp Catherine A
Current Estimated Value
Home Financials for this Owner
Home Financials are based on the most recent Mortgage that was taken out on this home.
Original Mortgage
$142,000
Outstanding Balance
$109,847
Interest Rate
2.1%
Mortgage Type
New Conventional
Estimated Equity
$357,039
Purchase Details
Closed on
Jun 21, 2012
Sold by
Blair Allison and Blair John
Bought by
Arp Garson T and Perry Arp Catherine A
Home Financials for this Owner
Home Financials are based on the most recent Mortgage that was taken out on this home.
Original Mortgage
$169,964
Interest Rate
3.75%
Mortgage Type
FHA
Purchase Details
Closed on
Oct 12, 2004
Sold by
Happe Richard L and Happe Tamara L
Bought by
Blair Allison and Blair John
Home Financials for this Owner
Home Financials are based on the most recent Mortgage that was taken out on this home.
Original Mortgage
$143,645
Interest Rate
5.72%
Mortgage Type
FHA
Create a Home Valuation Report for This Property
The Home Valuation Report is an in-depth analysis detailing your home's value as well as a comparison with similar homes in the area
Home Values in the Area
Average Home Value in this Area
Purchase History
| Date | Buyer | Sale Price | Title Company |
|---|---|---|---|
| Arp Garson T | -- | First American Title | |
| Arp Garson T | $173,100 | First American | |
| Blair Allison | $145,900 | Ticor Title |
Source: Public Records
Mortgage History
| Date | Status | Borrower | Loan Amount |
|---|---|---|---|
| Open | Arp Garson T | $142,000 | |
| Closed | Arp Garson T | $169,964 | |
| Previous Owner | Blair Allison | $143,645 |
Source: Public Records
Tax History Compared to Growth
Tax History
| Year | Tax Paid | Tax Assessment Tax Assessment Total Assessment is a certain percentage of the fair market value that is determined by local assessors to be the total taxable value of land and additions on the property. | Land | Improvement |
|---|---|---|---|---|
| 2025 | $2,923 | $177,310 | $57,230 | $120,080 |
| 2024 | $2,923 | $172,150 | $55,560 | $116,590 |
| 2023 | $3,045 | $167,140 | $53,940 | $113,200 |
| 2022 | $2,740 | $162,280 | $52,370 | $109,910 |
| 2021 | $2,709 | $157,560 | $50,840 | $106,720 |
| 2020 | $2,602 | $152,980 | $49,360 | $103,620 |
| 2019 | $2,526 | $148,530 | $47,920 | $100,610 |
| 2018 | $2,439 | $144,210 | $46,530 | $97,680 |
| 2017 | $2,426 | $140,010 | $45,170 | $94,840 |
| 2016 | $2,479 | $135,940 | $43,860 | $92,080 |
| 2015 | $2,370 | $131,990 | $42,580 | $89,410 |
| 2014 | $2,317 | $128,150 | $41,340 | $86,810 |
Source: Public Records
Map
Nearby Homes
- 235 Edwards (#104) Rd S Unit 104
- 277 Edwards Rd S
- 277 Edwards Rd S Unit 133
- 151 Edwards (#46) Rd S Unit 46
- 151 S Edwards (151) Rd
- 355 Jacobson Ct S
- 101 Edwards Rd S Unit 10-B Rd S
- 235 Edwards Rd S Unit 104
- 1329 Price Ln E
- 1370 Bentley St E
- 416 Yellowstone Dr S
- 309 Atwater St S
- 1390 Gwinn St E
- 1176 Gwinn St E
- 709 Sunnycroft Ln
- 1082 Alberta Ave E
- 858 Main St E
- 782 Edwards Rd S
- 761 Devonshire Ln
- 1470 Ash Creek Dr E
- 234 Edwards Rd S
- 238 Edwards Rd
- 190 Edwards Rd
- 209 Jacobson Way S
- 244 Edwards Rd S
- 244 Edwards Rd
- 170 Edwards Rd
- 87 Davis Ln
- 221 Jacobson Way S
- 775 Edwards Rd S
- 746 Edwards Rd S
- 262 Edwards Rd
- 1397 Jacobson Way E
- 150 Edwards Rd S
- 253 Jacobson Way S
- 59 Davis Ln
- 150 Edwards Rd
- 227 Edwards Rd S Unit 127
- 278 Edwards Rd
- 278 Edwards Rd S