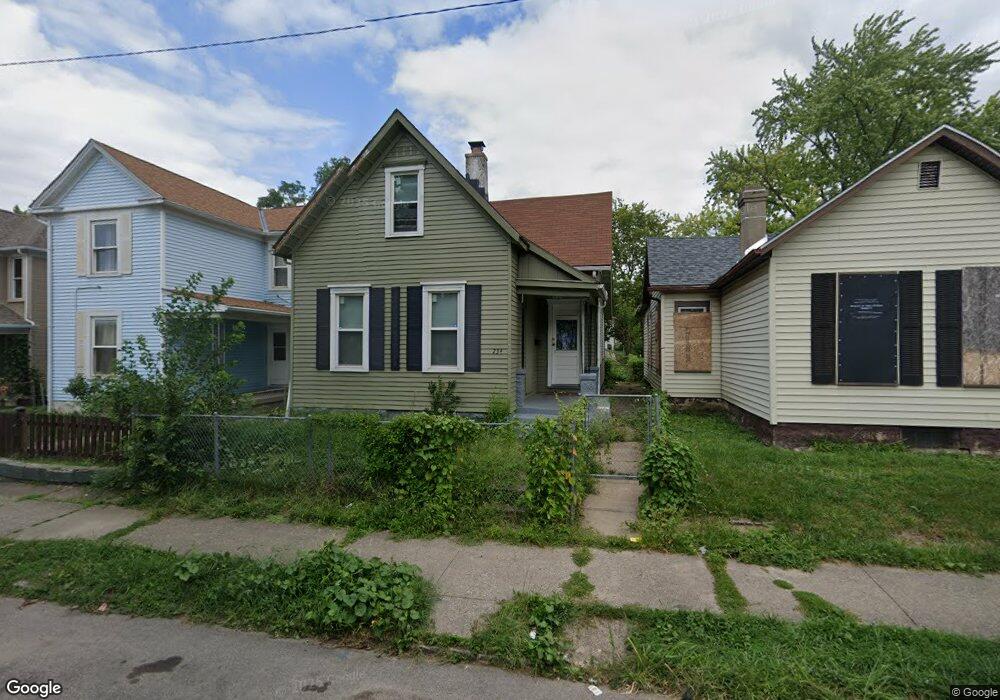
234 Fillmore St Unit 51 Dayton, OH 45410
Twin Towers NeighborhoodEstimated Value: $73,051 - $132,000
3
Beds
1
Bath
1,042
Sq Ft
$89/Sq Ft
Est. Value
About This Home
This home is located at 234 Fillmore St Unit 51, Dayton, OH 45410 and is currently estimated at $92,763, approximately $89 per square foot. 234 Fillmore St Unit 51 is a home located in Montgomery County with nearby schools including Ruskin Elementary School, Kiser Elementary, and St. Anthony Elementary School.
Ownership History
Date
Name
Owned For
Owner Type
Purchase Details
Closed on
Aug 6, 2020
Sold by
Bed & Breakfast Property Management Inc
Bought by
Wea Duen Shun and Duen Shun Wen
Current Estimated Value
Purchase Details
Closed on
Mar 27, 2020
Sold by
Csf And Sons Llc
Bought by
Bed & Breakfast Property Management Inc
Purchase Details
Closed on
Dec 5, 2018
Sold by
All Ohio Home Buying Llc
Bought by
Csf And Sons Llc
Purchase Details
Closed on
Dec 4, 2018
Sold by
Cornett Janice J and Cornett James
Bought by
All Ohio Home Buying Llc
Purchase Details
Closed on
Nov 21, 2018
Sold by
Cornett James and Cornett Janice J
Bought by
Cornett Janice J and Fugate Janice J
Purchase Details
Closed on
Feb 10, 1998
Sold by
Fugate Rufus V
Bought by
Fugate Janice J
Create a Home Valuation Report for This Property
The Home Valuation Report is an in-depth analysis detailing your home's value as well as a comparison with similar homes in the area
Home Values in the Area
Average Home Value in this Area
Purchase History
| Date | Buyer | Sale Price | Title Company |
|---|---|---|---|
| Wea Duen Shun | $82,900 | None Available | |
| Bed & Breakfast Property Management Inc | $25,000 | None Available | |
| Csf And Sons Llc | $18,000 | None Available | |
| All Ohio Home Buying Llc | $10,000 | None Available | |
| Cornett Janice J | -- | None Available | |
| Fugate Janice J | -- | -- | |
| Fugate Janice J | -- | -- |
Source: Public Records
Tax History Compared to Growth
Tax History
| Year | Tax Paid | Tax Assessment Tax Assessment Total Assessment is a certain percentage of the fair market value that is determined by local assessors to be the total taxable value of land and additions on the property. | Land | Improvement |
|---|---|---|---|---|
| 2024 | $624 | $8,750 | $2,620 | $6,130 |
| 2023 | $624 | $8,750 | $2,620 | $6,130 |
| 2022 | $668 | $8,750 | $2,620 | $6,130 |
| 2021 | $664 | $8,750 | $2,620 | $6,130 |
| 2020 | $870 | $11,900 | $2,620 | $9,280 |
| 2019 | $817 | $9,770 | $2,620 | $7,150 |
| 2018 | $798 | $9,770 | $2,620 | $7,150 |
| 2017 | $791 | $9,770 | $2,620 | $7,150 |
| 2016 | $891 | $10,510 | $2,620 | $7,890 |
| 2015 | $843 | $10,510 | $2,620 | $7,890 |
| 2014 | $843 | $10,510 | $2,620 | $7,890 |
| 2012 | -- | $10,600 | $2,620 | $7,980 |
Source: Public Records
Map
Nearby Homes
- 216 Fillmore St
- 937 Steele Ave
- 136 Dover St
- 337 Clover St
- 1574 Wayne Ave Unit 1572
- 1573 Wayne Ave
- 1113 Demphle Ave
- 357 Xenia Ave
- 117 Heaton Ave
- 27 Margaret St
- 355 Park Dr
- 284 Mcclure St
- 154 Gunckel Ave
- 1154 Demphle Ave
- 215 Heaton Ave
- 112 Missouri Ave
- 519 Wyoming St
- 34 Clover St
- 630 Hulbert St
- 229 James St
- 234 Fillmore St
- 240 Fillmore St
- 228 Fillmore St
- 242 Fillmore St
- 248 Fillmore St
- 224 Fillmore St
- 226 Fillmore St Unit 224
- 252 Fillmore St
- 220 Fillmore St
- 903 Steele Ave
- 903 1/2 Steele Ave
- 907 Steele Ave
- 911 Steele Ave
- 915 Steele Ave
- 231 Fillmore St
- 241 Fillmore St
- 919 Steele Ave
- 833 Steele Ave
- 245 Fillmore St
- 235 Fillmore St