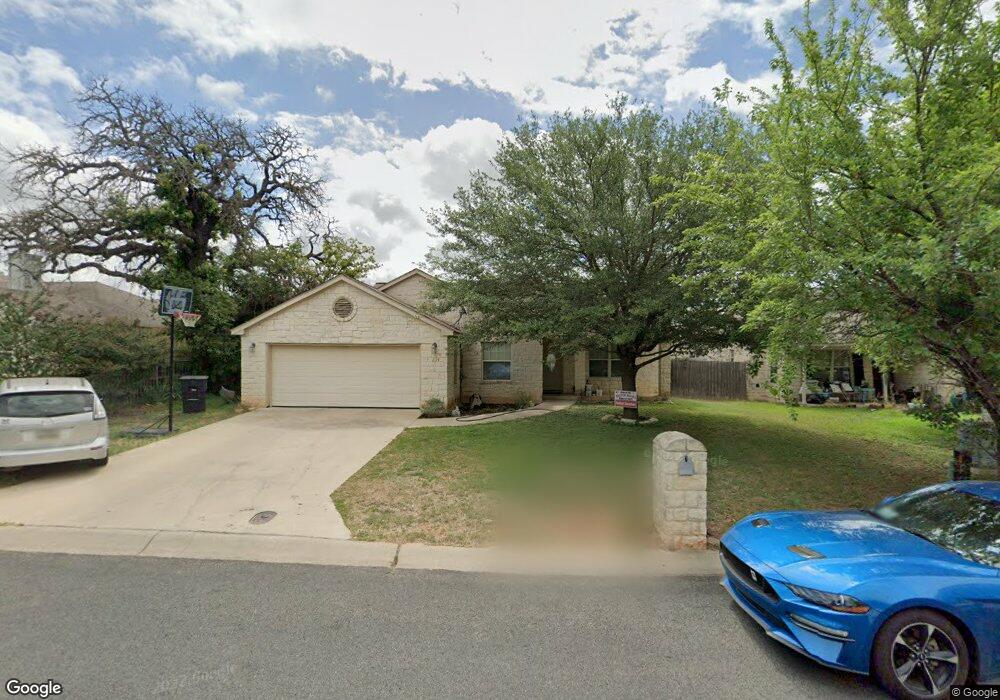
234 Green Oaks Loop Fredericksburg, TX 78624
Estimated Value: $313,183 - $413,000
--
Bed
--
Bath
1,354
Sq Ft
$266/Sq Ft
Est. Value
About This Home
This home is located at 234 Green Oaks Loop, Fredericksburg, TX 78624 and is currently estimated at $360,796, approximately $266 per square foot. 234 Green Oaks Loop is a home located in Gillespie County with nearby schools including Fredericksburg High School, St. Mary's Catholic School, and Ambleside School of Fredericksburg.
Ownership History
Date
Name
Owned For
Owner Type
Purchase Details
Closed on
Jul 2, 2008
Sold by
Allen Mary Ann
Bought by
Sanchez Rafael and Sanchez Humbertina A
Current Estimated Value
Home Financials for this Owner
Home Financials are based on the most recent Mortgage that was taken out on this home.
Original Mortgage
$172,296
Outstanding Balance
$110,222
Interest Rate
5.99%
Mortgage Type
FHA
Estimated Equity
$250,574
Purchase Details
Closed on
Feb 3, 2006
Sold by
Terracotta Lone Star Hjome Builder Inc
Bought by
Allen Mary Ann
Home Financials for this Owner
Home Financials are based on the most recent Mortgage that was taken out on this home.
Original Mortgage
$24,150
Interest Rate
6.15%
Mortgage Type
Stand Alone Second
Create a Home Valuation Report for This Property
The Home Valuation Report is an in-depth analysis detailing your home's value as well as a comparison with similar homes in the area
Home Values in the Area
Average Home Value in this Area
Purchase History
| Date | Buyer | Sale Price | Title Company |
|---|---|---|---|
| Sanchez Rafael | -- | None Available | |
| Allen Mary Ann | -- | None Available |
Source: Public Records
Mortgage History
| Date | Status | Borrower | Loan Amount |
|---|---|---|---|
| Open | Sanchez Rafael | $172,296 | |
| Previous Owner | Allen Mary Ann | $24,150 | |
| Previous Owner | Allen Mary Ann | $136,850 |
Source: Public Records
Tax History Compared to Growth
Tax History
| Year | Tax Paid | Tax Assessment Tax Assessment Total Assessment is a certain percentage of the fair market value that is determined by local assessors to be the total taxable value of land and additions on the property. | Land | Improvement |
|---|---|---|---|---|
| 2025 | $4,101 | $327,610 | $93,950 | $233,660 |
| 2024 | $4,101 | $316,231 | $93,950 | $236,830 |
| 2023 | $3,522 | $287,483 | $93,950 | $236,830 |
| 2022 | $3,906 | $291,380 | $67,640 | $223,740 |
| 2021 | $4,008 | $238,950 | $39,460 | $199,490 |
| 2020 | $3,720 | $215,990 | $38,480 | $177,510 |
| 2019 | $4,130 | $231,140 | $38,480 | $192,660 |
| 2018 | $3,707 | $208,370 | $33,450 | $174,920 |
| 2017 | $3,705 | $202,620 | $33,150 | $169,470 |
| 2016 | $3,251 | $177,780 | $25,000 | $152,780 |
| 2015 | -- | $169,840 | $25,000 | $144,840 |
| 2014 | -- | $161,880 | $25,000 | $136,880 |
Source: Public Records
Map
Nearby Homes
- 67 Sky Ln
- 204 Green Meadows Ln
- 60 Ale Ct
- 111 Green Meadows Blvd
- 221 Pyka Rd
- 712 Grace Ln
- 720 Darlington Dr
- 713 Englemann Oak Dr
- 711 Englemann Oak Dr
- 1104 Post Oak Rd Unit 17
- 908 Smokey Oak Dr
- 204 Windmill Oaks Ave
- 602 Atkins Ct Unit 111
- 601 Atkins Ct Unit 113
- 717 Chinkapin Dr
- 808 Gray Oak Ct
- 707 Chinkapin Dr
- 608 Gibson Ct
- 608 Gibson Ct Unit 107
- 701 Grace Ln
- 240 Green Oaks Loop
- 238 Green Oaks Loop
- 202 Green Oaks Loop
- 204 Green Oaks Loop
- 236 Green Oaks Loop
- 206 Green Oaks Loop
- 225 Green Meadows Blvd
- 237 Green Oaks Loop
- 227 Green Meadows Blvd
- 0 Green Oaks Loop Unit 17 15603
- 0 Green Oaks Loop Unit 28 15614
- 0 Green Oaks Loop Unit 21 15607
- 0 Green Oaks Loop Unit 19 15605
- 0 Green Oaks Loop Unit 25 15611
- 0 Green Oaks Loop Unit 20 15606
- 0 Green Oaks Loop Unit 15 15601
- 0 Green Oaks Loop Unit 26 15612
- 0 Green Oaks Loop Unit 23 15609
- 0 Green Oaks Loop Unit 34 15620
- 0 Green Oaks Loop Unit 22 15608