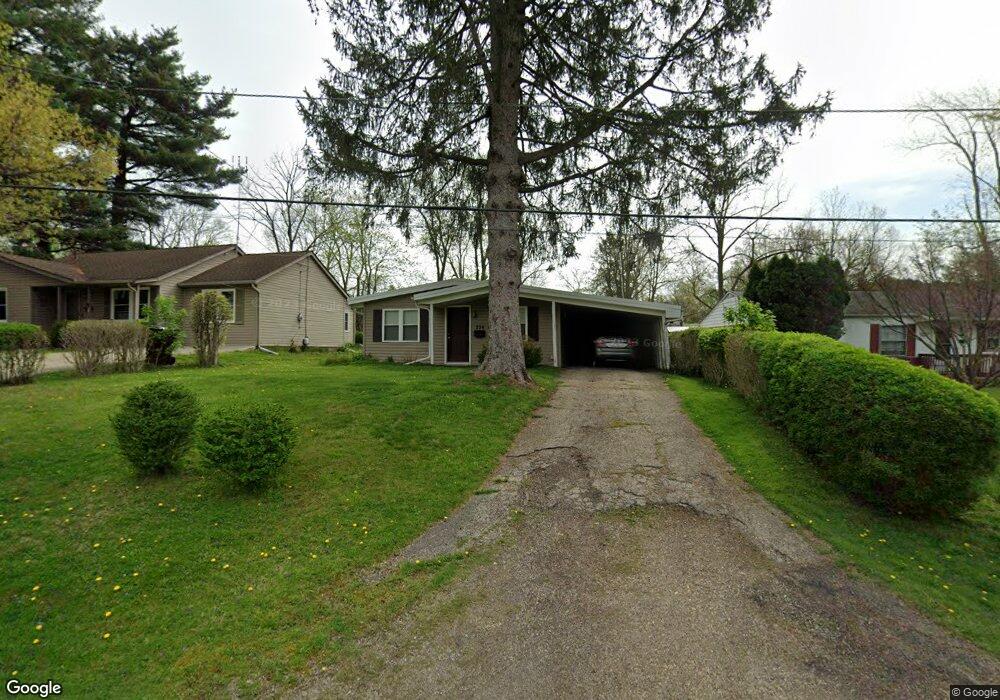
234 Hull St Newark, OH 43055
Estimated Value: $161,594 - $224,000
2
Beds
1
Bath
1,024
Sq Ft
$194/Sq Ft
Est. Value
About This Home
This home is located at 234 Hull St, Newark, OH 43055 and is currently estimated at $198,649, approximately $193 per square foot. 234 Hull St is a home located in Licking County with nearby schools including John Clem Elementary School, Liberty Middle School, and Newark High School.
Ownership History
Date
Name
Owned For
Owner Type
Purchase Details
Closed on
Jul 8, 2011
Sold by
Smith Gerald L
Bought by
Clouston Jeffrey Scott
Current Estimated Value
Home Financials for this Owner
Home Financials are based on the most recent Mortgage that was taken out on this home.
Original Mortgage
$81,870
Outstanding Balance
$58,882
Interest Rate
5.5%
Mortgage Type
FHA
Estimated Equity
$139,767
Purchase Details
Closed on
Nov 19, 2009
Sold by
Coblentz Phillip and Coblentz Elsie M
Bought by
Smith Gerald L
Home Financials for this Owner
Home Financials are based on the most recent Mortgage that was taken out on this home.
Original Mortgage
$78,755
Interest Rate
4.9%
Mortgage Type
Unknown
Purchase Details
Closed on
May 11, 2009
Sold by
Roach Brenda Faye and Scott Nora
Bought by
Coblentz Phillip
Create a Home Valuation Report for This Property
The Home Valuation Report is an in-depth analysis detailing your home's value as well as a comparison with similar homes in the area
Home Values in the Area
Average Home Value in this Area
Purchase History
| Date | Buyer | Sale Price | Title Company |
|---|---|---|---|
| Clouston Jeffrey Scott | $84,000 | Attorney | |
| Smith Gerald L | $82,900 | Attorney | |
| Coblentz Phillip | $26,000 | Capital Tit |
Source: Public Records
Mortgage History
| Date | Status | Borrower | Loan Amount |
|---|---|---|---|
| Open | Clouston Jeffrey Scott | $81,870 | |
| Previous Owner | Smith Gerald L | $78,755 |
Source: Public Records
Tax History Compared to Growth
Tax History
| Year | Tax Paid | Tax Assessment Tax Assessment Total Assessment is a certain percentage of the fair market value that is determined by local assessors to be the total taxable value of land and additions on the property. | Land | Improvement |
|---|---|---|---|---|
| 2024 | $984 | $37,350 | $13,090 | $24,260 |
| 2023 | $1,007 | $37,350 | $13,090 | $24,260 |
| 2022 | $784 | $28,210 | $8,190 | $20,020 |
| 2021 | $822 | $28,210 | $8,190 | $20,020 |
| 2020 | $841 | $28,210 | $8,190 | $20,020 |
| 2019 | $1,082 | $24,160 | $7,460 | $16,700 |
| 2018 | $1,083 | $0 | $0 | $0 |
| 2017 | $1,187 | $0 | $0 | $0 |
| 2016 | $1,308 | $0 | $0 | $0 |
| 2015 | $1,337 | $0 | $0 | $0 |
| 2014 | $1,712 | $0 | $0 | $0 |
| 2013 | $1,267 | $0 | $0 | $0 |
Source: Public Records
Map
Nearby Homes