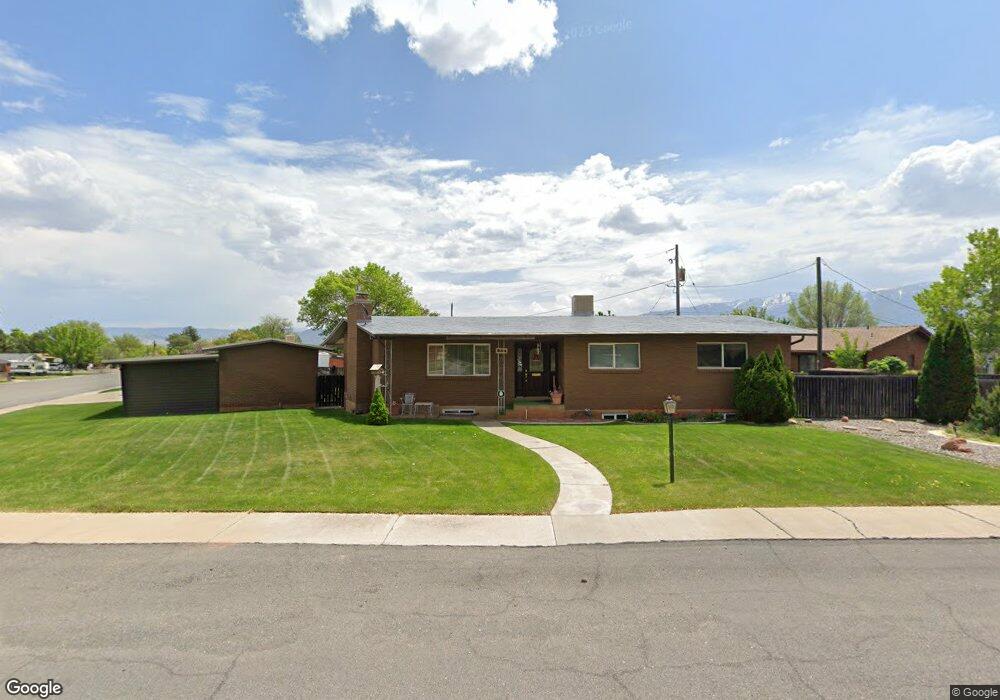
234 N Redview Dr Richfield, UT 84701
Estimated Value: $345,000 - $384,000
6
Beds
2
Baths
2,692
Sq Ft
$135/Sq Ft
Est. Value
About This Home
This home is located at 234 N Redview Dr, Richfield, UT 84701 and is currently estimated at $364,566, approximately $135 per square foot. 234 N Redview Dr is a home located in Sevier County with nearby schools including Pahvant School, Ashman School, and Red Hills Middle School.
Ownership History
Date
Name
Owned For
Owner Type
Purchase Details
Closed on
Nov 8, 2023
Sold by
Benson Richard S
Bought by
Benson Richard S and Benson Amber
Current Estimated Value
Home Financials for this Owner
Home Financials are based on the most recent Mortgage that was taken out on this home.
Original Mortgage
$280,000
Outstanding Balance
$274,191
Interest Rate
7.31%
Mortgage Type
New Conventional
Estimated Equity
$90,375
Create a Home Valuation Report for This Property
The Home Valuation Report is an in-depth analysis detailing your home's value as well as a comparison with similar homes in the area
Purchase History
| Date | Buyer | Sale Price | Title Company |
|---|---|---|---|
| Benson Richard S | -- | First American Title | |
| Benson Richard S | -- | First American Title |
Source: Public Records
Mortgage History
| Date | Status | Borrower | Loan Amount |
|---|---|---|---|
| Open | Benson Richard S | $280,000 |
Source: Public Records
Tax History
| Year | Tax Paid | Tax Assessment Tax Assessment Total Assessment is a certain percentage of the fair market value that is determined by local assessors to be the total taxable value of land and additions on the property. | Land | Improvement |
|---|---|---|---|---|
| 2025 | $1,757 | $180,994 | $48,011 | $132,983 |
| 2024 | $1,757 | $195,650 | $40,747 | $154,903 |
| 2023 | $1,936 | $191,259 | $37,010 | $154,249 |
| 2022 | $1,784 | $162,892 | $35,987 | $126,905 |
| 2021 | $1,702 | $130,786 | $33,034 | $97,752 |
| 2020 | $1,490 | $111,320 | $22,374 | $88,946 |
| 2019 | $1,271 | $100,520 | $18,650 | $81,870 |
| 2018 | $1,319 | $93,450 | $18,650 | $74,800 |
| 2017 | $1,312 | $88,740 | $18,650 | $70,090 |
| 2016 | $960 | $88,740 | $0 | $0 |
| 2015 | $960 | $87,300 | $0 | $0 |
| 2014 | $960 | $83,560 | $0 | $0 |
Source: Public Records
Map
Nearby Homes
Your Personal Tour Guide
Ask me questions while you tour the home.