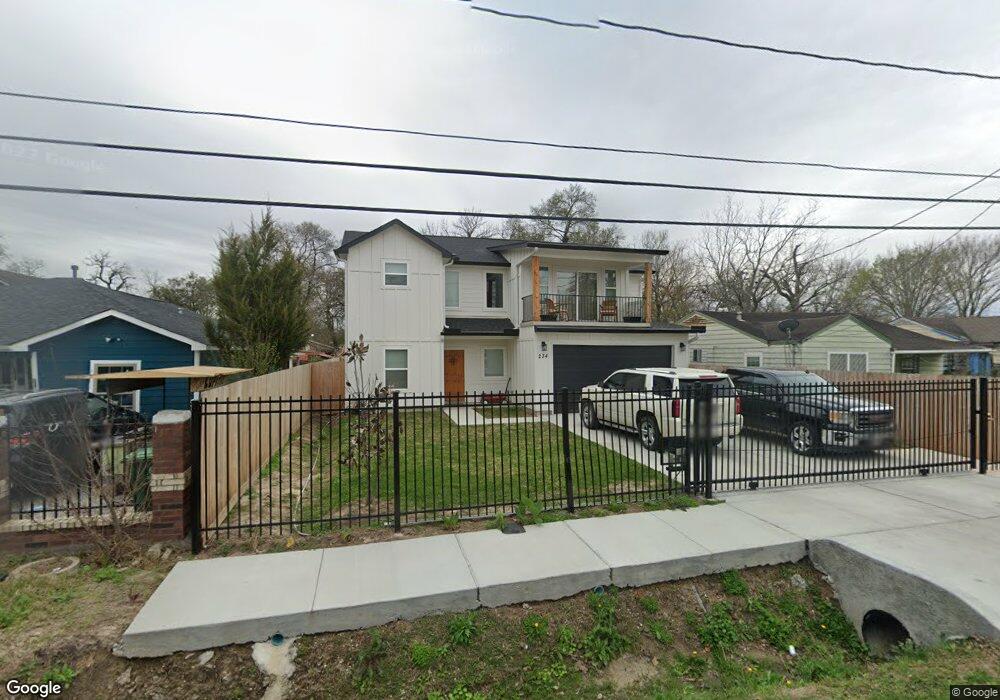
234 Neyland St Houston, TX 77022
Northside-Northline NeighborhoodEstimated Value: $384,000 - $399,000
4
Beds
3
Baths
2,165
Sq Ft
$182/Sq Ft
Est. Value
About This Home
This home is located at 234 Neyland St, Houston, TX 77022 and is currently estimated at $394,264, approximately $182 per square foot. 234 Neyland St is a home with nearby schools including Herrera Elementary School, Burbank Middle School, and Sam Houston Math, Science & Technology Center.
Ownership History
Date
Name
Owned For
Owner Type
Purchase Details
Closed on
May 1, 2017
Sold by
Gonlalez Teresa R
Bought by
Rodriguez Joseph Jorge and Rodriguez Geybileticia
Current Estimated Value
Home Financials for this Owner
Home Financials are based on the most recent Mortgage that was taken out on this home.
Original Mortgage
$36,800
Outstanding Balance
$30,712
Interest Rate
4.23%
Mortgage Type
Commercial
Estimated Equity
$363,552
Purchase Details
Closed on
Apr 21, 2005
Sold by
Brittain H G and Brittain Lillian
Bought by
Gonzalez Teresa R
Create a Home Valuation Report for This Property
The Home Valuation Report is an in-depth analysis detailing your home's value as well as a comparison with similar homes in the area
Home Values in the Area
Average Home Value in this Area
Purchase History
| Date | Buyer | Sale Price | Title Company |
|---|---|---|---|
| Rodriguez Joseph Jorge | -- | None Available | |
| Gonzalez Teresa R | $16,000 | -- |
Source: Public Records
Mortgage History
| Date | Status | Borrower | Loan Amount |
|---|---|---|---|
| Open | Rodriguez Joseph Jorge | $36,800 |
Source: Public Records
Tax History Compared to Growth
Tax History
| Year | Tax Paid | Tax Assessment Tax Assessment Total Assessment is a certain percentage of the fair market value that is determined by local assessors to be the total taxable value of land and additions on the property. | Land | Improvement |
|---|---|---|---|---|
| 2025 | $5,495 | $445,255 | $98,600 | $346,655 |
| 2024 | $5,495 | $379,511 | $98,600 | $280,911 |
| 2023 | $5,495 | $425,608 | $85,550 | $340,058 |
| 2022 | $5,971 | $271,182 | $63,800 | $207,382 |
| 2021 | $1,487 | $63,800 | $63,800 | $0 |
| 2020 | $1,545 | $63,800 | $63,800 | $0 |
| 2019 | $1,321 | $52,200 | $52,200 | $0 |
| 2018 | $917 | $36,250 | $36,250 | $0 |
| 2017 | $917 | $36,250 | $36,250 | $0 |
| 2016 | $917 | $36,250 | $36,250 | $0 |
| 2015 | $522 | $29,000 | $29,000 | $0 |
| 2014 | $522 | $20,300 | $20,300 | $0 |
Source: Public Records
Map
Nearby Homes
- 7111 Bauman Rd
- 249 Basswood St
- 7311 Roswell St
- 7317 Roswell St
- 164 Wallace St
- 7015 Roswell St
- 7014 Finn St
- 7018 Finn St
- 7315 Roswell St
- 210 Van Molan St
- 7009 Amber St
- 121-123 Van Molan St
- 311 & 309 Bennington St
- 105 Oddo St
- 428 Van Molan St
- 65 Neyland St
- 245 Palmyra St
- 7523 Roswell St
- 7206 Helmers St Unit A
- 6825 Appleton St
- 238 Neyland St
- 232 Neyland St
- 240 Neyland St
- 230 Neyland St
- 7119 Bauman Rd
- 228 Neyland St
- 7117 Bauman Rd
- 233 Neyland St
- 235 Neyland St
- 231 Neyland St
- 226 Neyland St
- 241 Neyland St
- 7115 Bauman Rd
- 229 Neyland St
- 229 Neyland St Unit A
- 229 Neyland St Unit B
- 229 Neyland St Unit C
- 243 Neyland St
- 227 Neyland St
- 224 Neyland St