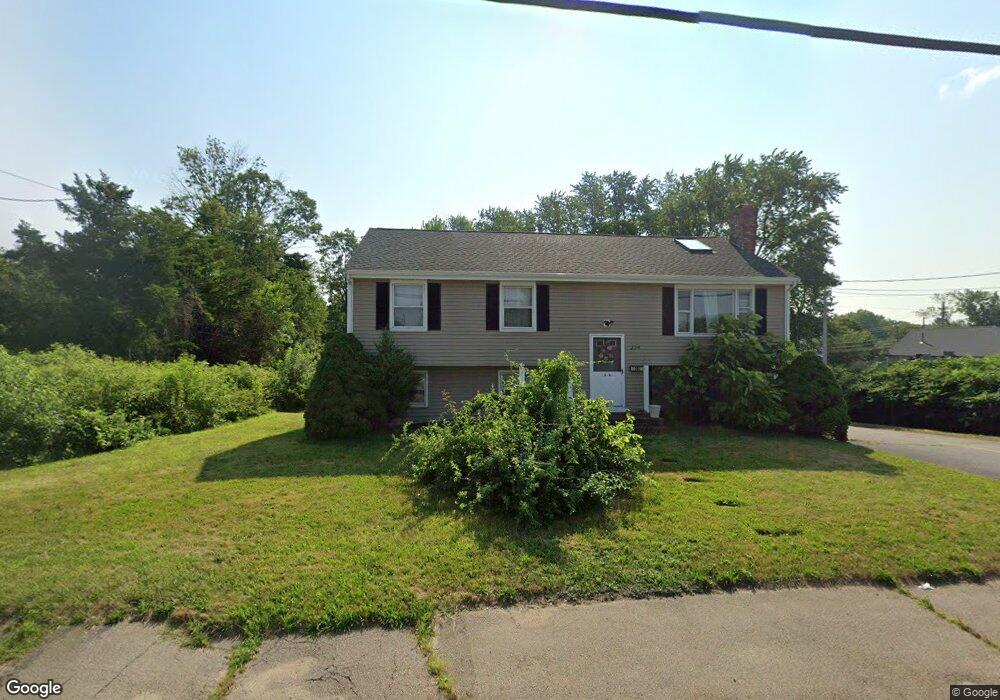
234 Quincy St Brockton, MA 02302
Estimated Value: $456,000 - $612,000
3
Beds
3
Baths
2,200
Sq Ft
$238/Sq Ft
Est. Value
About This Home
This home is located at 234 Quincy St, Brockton, MA 02302 and is currently estimated at $524,338, approximately $238 per square foot. 234 Quincy St is a home located in Plymouth County with nearby schools including Brookfield Elementary School, Mary E. Baker Elementary School, and Downey Elementary School.
Ownership History
Date
Name
Owned For
Owner Type
Purchase Details
Closed on
May 5, 2008
Sold by
Hassan Edward F
Bought by
Millett George A
Current Estimated Value
Purchase Details
Closed on
Jan 19, 1999
Sold by
Caviasca Frank D and Caviasca Lisa M
Bought by
Hassan Edward F
Purchase Details
Closed on
Oct 18, 1991
Sold by
Sample Robert A and Sample Howard M
Bought by
Caviasca Frank D and Caviasca Lisa M
Purchase Details
Closed on
Mar 26, 1987
Sold by
Leonard Mark L
Bought by
Sample Robert A
Create a Home Valuation Report for This Property
The Home Valuation Report is an in-depth analysis detailing your home's value as well as a comparison with similar homes in the area
Home Values in the Area
Average Home Value in this Area
Purchase History
| Date | Buyer | Sale Price | Title Company |
|---|---|---|---|
| Millett George A | $205,000 | -- | |
| Hassan Edward F | $150,000 | -- | |
| Caviasca Frank D | $115,000 | -- | |
| Sample Robert A | $127,500 | -- |
Source: Public Records
Mortgage History
| Date | Status | Borrower | Loan Amount |
|---|---|---|---|
| Previous Owner | Sample Robert A | $160,000 | |
| Previous Owner | Sample Robert A | $50,000 | |
| Previous Owner | Sample Robert A | $50,000 |
Source: Public Records
Tax History Compared to Growth
Tax History
| Year | Tax Paid | Tax Assessment Tax Assessment Total Assessment is a certain percentage of the fair market value that is determined by local assessors to be the total taxable value of land and additions on the property. | Land | Improvement |
|---|---|---|---|---|
| 2025 | $5,572 | $460,100 | $160,900 | $299,200 |
| 2024 | $5,280 | $439,300 | $160,900 | $278,400 |
| 2023 | $5,178 | $398,900 | $126,900 | $272,000 |
| 2022 | $5,346 | $382,700 | $115,900 | $266,800 |
| 2021 | $4,918 | $339,200 | $105,000 | $234,200 |
| 2020 | $4,651 | $307,000 | $100,600 | $206,400 |
| 2019 | $4,440 | $285,700 | $93,600 | $192,100 |
| 2018 | $4,269 | $265,800 | $93,600 | $172,200 |
| 2017 | $3,916 | $243,200 | $93,600 | $149,600 |
| 2016 | $6,017 | $187,900 | $149,250 | $38,650 |
| 2015 | $6,366 | $187,900 | $149,250 | $38,650 |
| 2014 | $6,381 | $187,900 | $149,250 | $38,650 |
Source: Public Records
Map
Nearby Homes
- 232 Quincy St
- 228 Quincy St
- 224 Quincy St
- 233 Quincy St
- 247 Quincy St
- 231 Quincy St
- 216 Quincy St
- 255 Quincy St
- 255 Quincy St Unit End Cap
- 750 Centre St
- 209 Quincy St Unit 209
- 210 Quincy St
- 205 Quincy St
- 3 Muriel St
- 201 Quincy St
- 211 Quincy St
- 781 Centre St
- 781 Centre St Unit 2
- 781 Centre St Unit 1
- 11 Cranston St