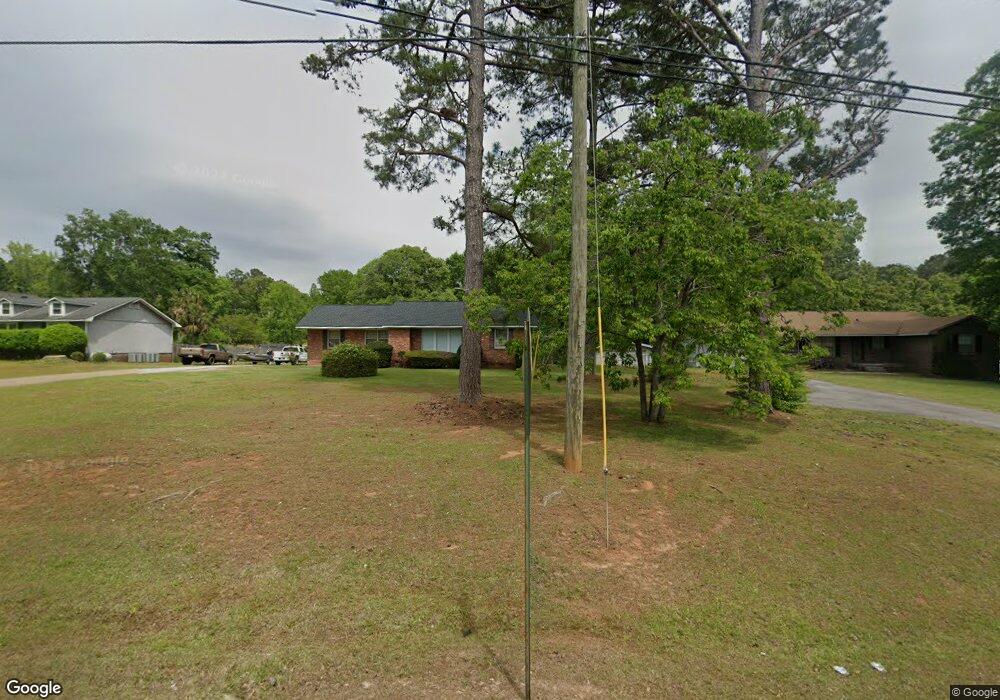
234 Sivell Rd Lagrange, GA 30241
Estimated Value: $217,286 - $259,000
3
Beds
2
Baths
1,516
Sq Ft
$152/Sq Ft
Est. Value
About This Home
This home is located at 234 Sivell Rd, Lagrange, GA 30241 and is currently estimated at $230,572, approximately $152 per square foot. 234 Sivell Rd is a home located in Troup County with nearby schools including Callaway Elementary School, Hogansville Elementary School, and Callaway Middle School.
Ownership History
Date
Name
Owned For
Owner Type
Purchase Details
Closed on
Feb 18, 2022
Sold by
Mccann Robyn G
Bought by
Mccann Thomas James Ty and Cha Hana
Current Estimated Value
Home Financials for this Owner
Home Financials are based on the most recent Mortgage that was taken out on this home.
Original Mortgage
$50,070
Interest Rate
3.69%
Mortgage Type
Cash
Purchase Details
Closed on
Sep 8, 2000
Sold by
Partidge Betty P
Bought by
Mccann Robyn G
Purchase Details
Closed on
Dec 1, 1987
Sold by
Dan Ric Inc
Bought by
Partidge Betty P
Purchase Details
Closed on
Feb 1, 1986
Sold by
Outland James and Outland Jean K
Bought by
Dan Ric Inc
Purchase Details
Closed on
Aug 20, 1979
Sold by
Gloria John E and Gloria Emory
Bought by
Outland James and Outland Jean K
Purchase Details
Closed on
Jan 1, 1973
Sold by
Robert L Bales
Bought by
Gloria John E and Gloria Emory
Purchase Details
Closed on
Jan 1, 1972
Bought by
Robert L Bales
Create a Home Valuation Report for This Property
The Home Valuation Report is an in-depth analysis detailing your home's value as well as a comparison with similar homes in the area
Purchase History
| Date | Buyer | Sale Price | Title Company |
|---|---|---|---|
| Mccann Thomas James Ty | $49,075 | -- | |
| Mccann Robyn G | $81,800 | -- | |
| Partidge Betty P | $13,200 | -- | |
| Dan Ric Inc | -- | -- | |
| Outland James | -- | -- | |
| Gloria John E | -- | -- | |
| Robert L Bales | -- | -- |
Source: Public Records
Mortgage History
| Date | Status | Borrower | Loan Amount |
|---|---|---|---|
| Closed | Mccann Thomas James Ty | $50,070 |
Source: Public Records
Tax History
| Year | Tax Paid | Tax Assessment Tax Assessment Total Assessment is a certain percentage of the fair market value that is determined by local assessors to be the total taxable value of land and additions on the property. | Land | Improvement |
|---|---|---|---|---|
| 2025 | $1,843 | $74,240 | $10,000 | $64,240 |
| 2024 | $1,843 | $69,560 | $10,000 | $59,560 |
| 2023 | $1,872 | $68,640 | $10,000 | $58,640 |
| 2022 | $1,779 | $65,720 | $10,000 | $55,720 |
| 2021 | $1,362 | $47,160 | $8,000 | $39,160 |
| 2020 | $1,362 | $47,160 | $8,000 | $39,160 |
| 2019 | $1,041 | $36,520 | $4,800 | $31,720 |
| 2018 | $914 | $32,280 | $6,000 | $26,280 |
| 2017 | $914 | $32,280 | $6,000 | $26,280 |
| 2016 | $889 | $31,463 | $6,000 | $25,463 |
| 2015 | $891 | $31,463 | $6,000 | $25,463 |
| 2014 | $852 | $30,123 | $6,000 | $24,123 |
| 2013 | -- | $30,880 | $6,000 | $24,880 |
Source: Public Records
Map
Nearby Homes
- 90 Beaver Run
- 119 Sir Lancelot St
- SMOKEMONT Smokemont Dr
- 124 Woodridge Cir
- 200 Freshwater Ct Unit 37
- 249 River Meadow Dr
- 10 Whitfield Rd
- 202 Freshwater Ct Unit E36
- 202 Freshwater Ct
- 402 Sweetwood Ct Unit LOT 2
- 204 Freshwater Ct
- 200 River Meadow Dr
- 206 Freshwater Ct Unit 34E
- 206 Freshwater Ct
- 300 Old Pond Rd
- 124 Shenandoah Ln
- 883 Hammett Rd
- 114 Shenandoah Ln
- 106 Shenandoah Ln Unit 26E
- 106 Shenandoah Ln
- 232 Sivell Rd Unit 17
- 232 Sivell Rd
- 236 Sivell Rd
- 230 Sivell Rd
- 235 Sivell Rd
- 231 Sivell Rd
- 300 Sivell Rd
- 237 Sivell Rd
- 226 Sivell Rd
- 97 Clearwater Dr
- 301 Sivell Rd
- 101 Pebble Dr
- 302 Sivell Rd
- 95 Clearwater Dr
- 101 Clearwater Dr
- 224 Sivell Rd
- 93 Clearwater Dr
- 303 Sivell Rd
- 304 Sivell Rd
- 101 Shannon Dr
Your Personal Tour Guide
Ask me questions while you tour the home.