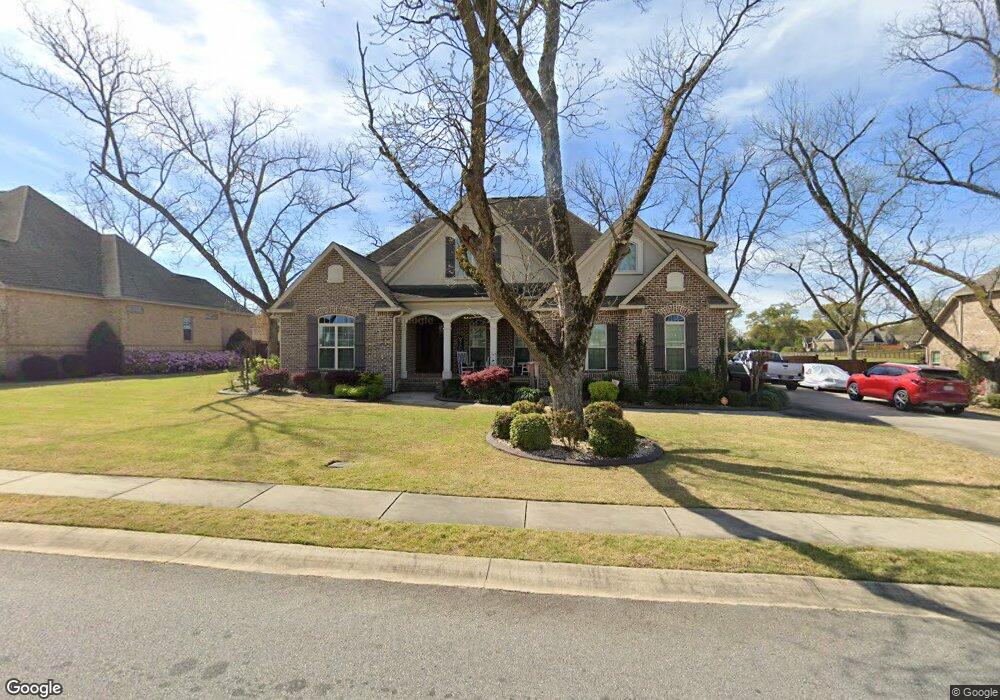
234 Stacy Ln Warner Robins, GA 31088
Estimated Value: $516,945 - $660,000
5
Beds
4
Baths
3,076
Sq Ft
$185/Sq Ft
Est. Value
About This Home
This home is located at 234 Stacy Ln, Warner Robins, GA 31088 and is currently estimated at $569,236, approximately $185 per square foot. 234 Stacy Ln is a home located in Houston County with nearby schools including Lake Joy Primary School, Lake Joy Elementary School, and Feagin Mill Middle School.
Ownership History
Date
Name
Owned For
Owner Type
Purchase Details
Closed on
Mar 18, 2016
Sold by
Trinity Built Homes Llc
Bought by
Johnson Charles and Johnson Angela
Current Estimated Value
Home Financials for this Owner
Home Financials are based on the most recent Mortgage that was taken out on this home.
Original Mortgage
$359,892
Outstanding Balance
$284,853
Interest Rate
3.65%
Mortgage Type
VA
Estimated Equity
$284,383
Purchase Details
Closed on
Dec 12, 2014
Sold by
Custom Homes By Jeff Llc
Bought by
Trinity Built Homes Llc
Home Financials for this Owner
Home Financials are based on the most recent Mortgage that was taken out on this home.
Original Mortgage
$288,000
Interest Rate
4.07%
Mortgage Type
New Conventional
Purchase Details
Closed on
Nov 14, 2014
Sold by
Ski Development Llc
Bought by
Custom Homes By Jeff Llc
Home Financials for this Owner
Home Financials are based on the most recent Mortgage that was taken out on this home.
Original Mortgage
$288,000
Interest Rate
4.07%
Mortgage Type
New Conventional
Create a Home Valuation Report for This Property
The Home Valuation Report is an in-depth analysis detailing your home's value as well as a comparison with similar homes in the area
Home Values in the Area
Average Home Value in this Area
Purchase History
| Date | Buyer | Sale Price | Title Company |
|---|---|---|---|
| Johnson Charles | $359,892 | -- | |
| Trinity Built Homes Llc | $60,000 | -- | |
| Custom Homes By Jeff Llc | -- | -- |
Source: Public Records
Mortgage History
| Date | Status | Borrower | Loan Amount |
|---|---|---|---|
| Open | Johnson Charles | $359,892 | |
| Previous Owner | Trinity Built Homes Llc | $288,000 |
Source: Public Records
Tax History Compared to Growth
Tax History
| Year | Tax Paid | Tax Assessment Tax Assessment Total Assessment is a certain percentage of the fair market value that is determined by local assessors to be the total taxable value of land and additions on the property. | Land | Improvement |
|---|---|---|---|---|
| 2024 | $6,622 | $202,360 | $20,000 | $182,360 |
| 2023 | $5,922 | $179,600 | $20,000 | $159,600 |
| 2022 | $3,729 | $162,160 | $20,000 | $142,160 |
| 2021 | $3,331 | $144,080 | $20,000 | $124,080 |
| 2020 | $3,054 | $131,440 | $20,000 | $111,440 |
| 2019 | $3,054 | $131,440 | $20,000 | $111,440 |
| 2018 | $3,054 | $131,440 | $20,000 | $111,440 |
| 2017 | $3,057 | $131,440 | $20,000 | $111,440 |
| 2016 | $3,061 | $131,440 | $20,000 | $111,440 |
| 2015 | -- | $27,782 | $20,000 | $7,782 |
Source: Public Records
Map
Nearby Homes
- 232 Stacy Ln
- 236 Stacy Ln
- 231 Stacy Ln
- 233 Stacy Ln
- 230 Stacy Ln
- 0 Stacy Ln Unit LOT 13 02849024
- 0 Stacy Ln Unit 8938263
- 0 Stacy Ln Unit 8030250
- 0 Stacy Ln Unit 8065461
- 0 Stacy Ln Unit 8095781
- 0 Stacy Ln Unit 8170918
- 0 Stacy Ln Unit 8271777
- 0 Stacy Ln Unit 8455916
- 0 Stacy Ln Unit 8341705
- 0 Stacy Ln Unit 8346392
- 401 Stacy Ln
- 229 Stacy Ln
- 300 Stacy Ln
- 228 Stacy Ln
- 225 Stacy Ln