Estimated Value: $197,000 - $207,000
3
Beds
2
Baths
1,441
Sq Ft
$140/Sq Ft
Est. Value
About This Home
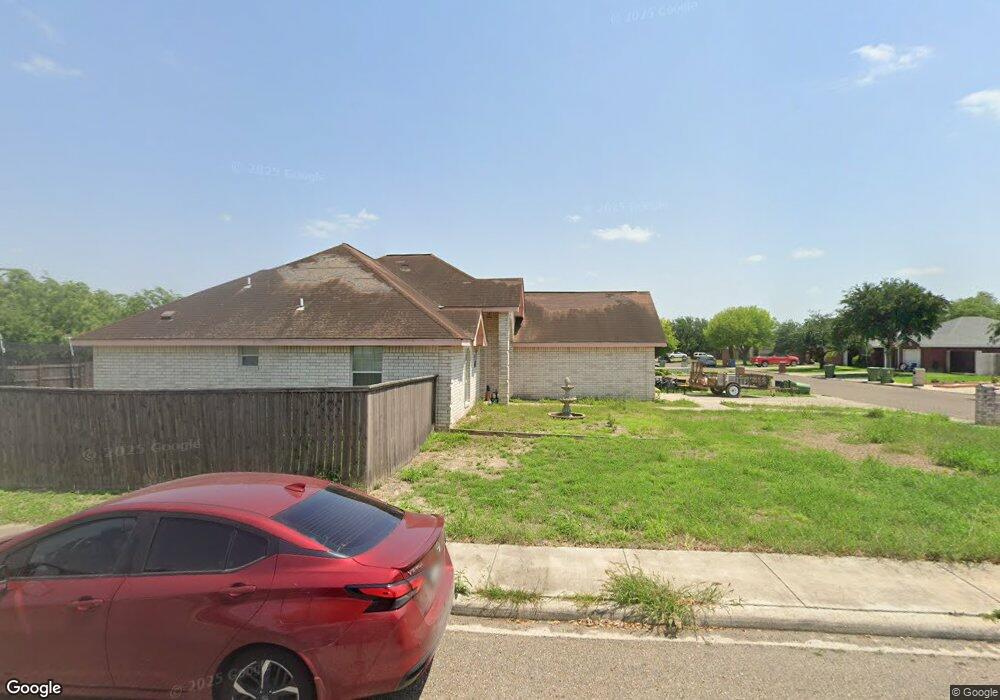
This home is located at 234 Vanilla, Alamo, TX 78516 and is currently estimated at $201,814, approximately $140 per square foot. 234 Vanilla is a home with nearby schools including Capt. D. Salinas Elementary School, A.P. Solis Middle School, and Donna High School.
Ownership History
Date
Name
Owned For
Owner Type
Purchase Details
Closed on
Dec 14, 2013
Sold by
United States Of America
Bought by
Rios Marlon I and Rios Carolina Lopez
Current Estimated Value
Home Financials for this Owner
Home Financials are based on the most recent Mortgage that was taken out on this home.
Original Mortgage
$102,742
Interest Rate
4.56%
Mortgage Type
USDA
Purchase Details
Closed on
Oct 6, 2009
Sold by
Rios Marlon Ivan and Rios Carolina
Bought by
United States Of America
Create a Home Valuation Report for This Property
The Home Valuation Report is an in-depth analysis detailing your home's value as well as a comparison with similar homes in the area
Home Values in the Area
Average Home Value in this Area
Purchase History
| Date | Buyer | Sale Price | Title Company |
|---|---|---|---|
| Rios Marlon I | $102,742 | Charge San Jacinto Title Svc | |
| United States Of America | $61,640 | None Available |
Source: Public Records
Mortgage History
| Date | Status | Borrower | Loan Amount |
|---|---|---|---|
| Previous Owner | Rios Marlon I | $102,742 |
Source: Public Records
Tax History Compared to Growth
Tax History
| Year | Tax Paid | Tax Assessment Tax Assessment Total Assessment is a certain percentage of the fair market value that is determined by local assessors to be the total taxable value of land and additions on the property. | Land | Improvement |
|---|---|---|---|---|
| 2025 | $3,261 | $184,462 | -- | -- |
| 2024 | $3,261 | $167,693 | -- | -- |
| 2023 | $3,880 | $152,448 | $0 | $0 |
| 2022 | $3,611 | $138,589 | $0 | $0 |
| 2021 | $3,306 | $125,990 | $31,554 | $111,497 |
| 2020 | $3,105 | $114,536 | $31,127 | $102,502 |
| 2019 | $2,855 | $104,124 | $21,320 | $82,804 |
| 2018 | $2,863 | $105,109 | $21,320 | $83,789 |
| 2017 | $2,954 | $107,081 | $21,320 | $85,761 |
| 2016 | $2,751 | $99,712 | $19,614 | $80,098 |
| 2015 | $2,275 | $100,622 | $19,614 | $81,008 |
Source: Public Records
Map
Nearby Homes