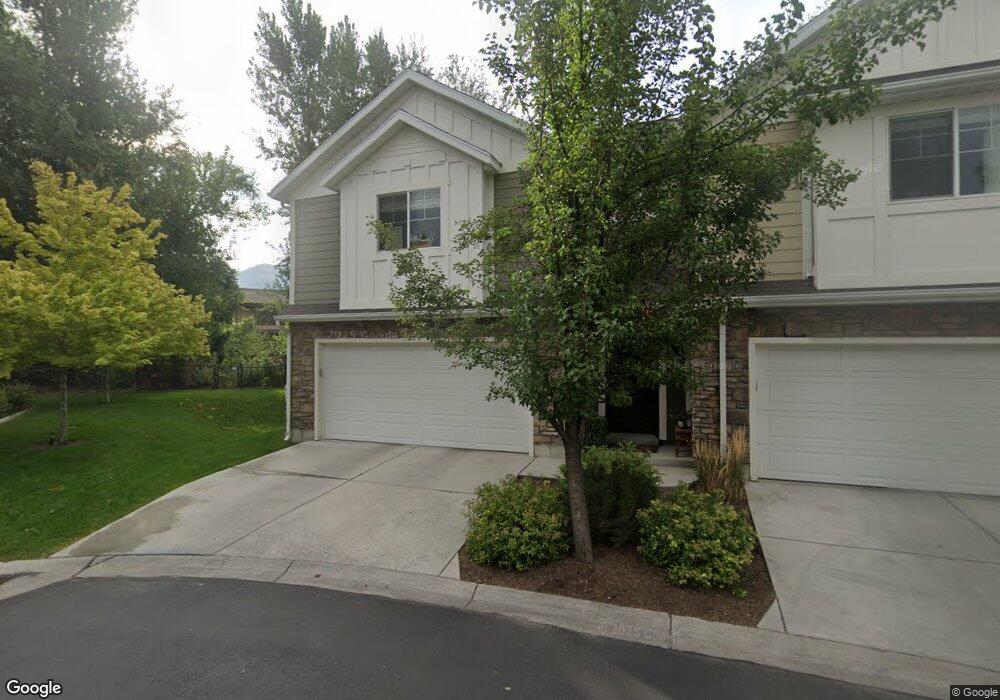
234 W 1030 S Logan, UT 84321
Woodruff NeighborhoodEstimated Value: $359,472 - $427,000
3
Beds
3
Baths
1,775
Sq Ft
$214/Sq Ft
Est. Value
About This Home
This home is located at 234 W 1030 S, Logan, UT 84321 and is currently estimated at $380,118, approximately $214 per square foot. 234 W 1030 S is a home located in Cache County with nearby schools including Hillcrest Elementary School, Mount Logan Middle School, and Logan High School.
Ownership History
Date
Name
Owned For
Owner Type
Purchase Details
Closed on
Feb 8, 2024
Sold by
Brasileiro Marcus Vc
Bought by
Heggie Darcy and Heggie Shanda
Current Estimated Value
Purchase Details
Closed on
Aug 8, 2012
Sold by
Drd Property Development Llc
Bought by
Brasileiro Marcus Vc
Home Financials for this Owner
Home Financials are based on the most recent Mortgage that was taken out on this home.
Original Mortgage
$7,720
Interest Rate
3.53%
Mortgage Type
Stand Alone Second
Create a Home Valuation Report for This Property
The Home Valuation Report is an in-depth analysis detailing your home's value as well as a comparison with similar homes in the area
Home Values in the Area
Average Home Value in this Area
Purchase History
| Date | Buyer | Sale Price | Title Company |
|---|---|---|---|
| Heggie Darcy | -- | Prospect Title Insurance Agenc | |
| Brasileiro Marcus Vc | -- | Pinnacle Title Ins Agency | |
| Drd Property Development Llc | -- | Pinnacle Title Ins Agency |
Source: Public Records
Mortgage History
| Date | Status | Borrower | Loan Amount |
|---|---|---|---|
| Previous Owner | Drd Property Development Llc | $7,720 | |
| Previous Owner | Brasileiro Marcus Vc | $176,641 |
Source: Public Records
Tax History Compared to Growth
Tax History
| Year | Tax Paid | Tax Assessment Tax Assessment Total Assessment is a certain percentage of the fair market value that is determined by local assessors to be the total taxable value of land and additions on the property. | Land | Improvement |
|---|---|---|---|---|
| 2025 | $2,582 | $333,935 | $0 | $0 |
| 2024 | $1,671 | $209,265 | $0 | $0 |
| 2023 | $1,550 | $185,130 | $0 | $0 |
| 2022 | $1,722 | $192,005 | $0 | $0 |
| 2021 | $1,363 | $234,819 | $63,000 | $171,819 |
| 2020 | $1,370 | $212,408 | $63,000 | $149,408 |
| 2019 | $1,432 | $212,408 | $63,000 | $149,408 |
| 2018 | $1,450 | $196,400 | $63,000 | $133,400 |
| 2017 | $1,421 | $101,750 | $0 | $0 |
| 2016 | $1,473 | $98,395 | $0 | $0 |
| 2015 | $1,396 | $96,305 | $0 | $0 |
| 2014 | $1,262 | $96,305 | $0 | $0 |
| 2013 | -- | $96,305 | $0 | $0 |
Source: Public Records
Map
Nearby Homes
- 238 W 1010 S Unit 43
- 233 W 1010 S
- 265 W 1010 S
- 268 W 1030 S
- 273 W 1010 S
- 866 Riverwood Dr
- 279 W 750 S
- 740 S 350 W
- 762 S 80 E
- 130 W 1260 S
- 476 Cobblestone
- 168 W 1275 S
- 410 Cobblestone
- 73 E 400 S
- 658 W 500 S
- 545 S 1215 W
- 475 W 60 S Unit L304
- 460 W 15 S Unit G202
- 470 W 15 S Unit F301
- 460 W 15 S Unit G201