Estimated Value: $184,000 - $212,000
4
Beds
3
Baths
2,180
Sq Ft
$90/Sq Ft
Est. Value
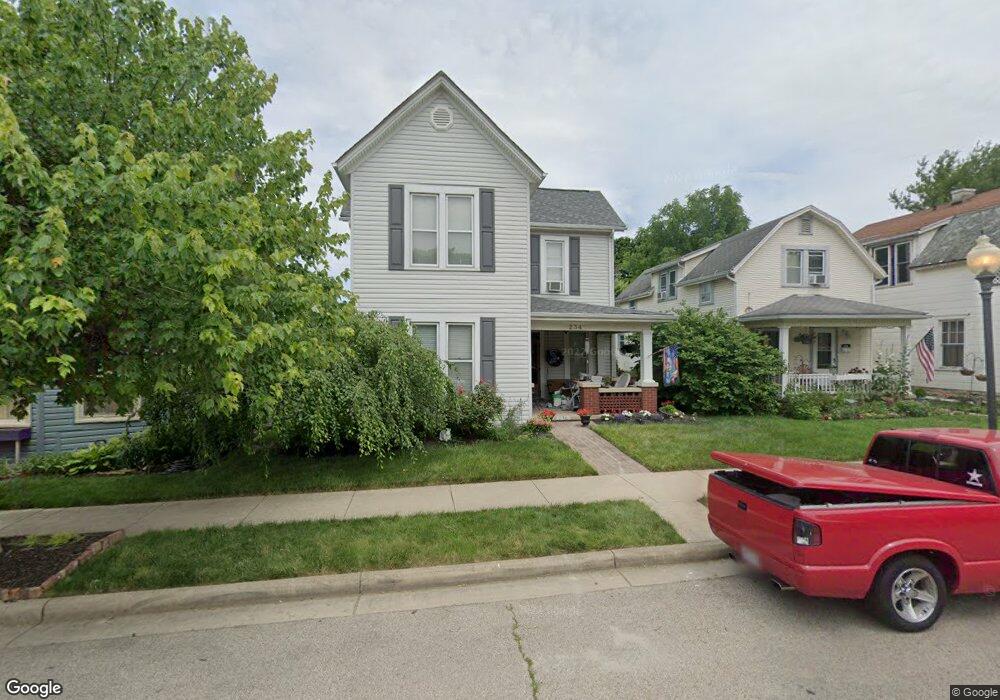
About This Home
This home is located at 234 W 3rd St, Xenia, OH 45385 and is currently estimated at $196,684, approximately $90 per square foot. 234 W 3rd St is a home located in Greene County with nearby schools including Xenia High School, Summit Academy Community School for Alternative Learners - Xenia, and Legacy Christian Academy.
Ownership History
Date
Name
Owned For
Owner Type
Purchase Details
Closed on
Aug 5, 2004
Sold by
Norvell Michael R and Norvell Deborah K
Bought by
Norvell Michael R and Norvell Deborah K
Current Estimated Value
Home Financials for this Owner
Home Financials are based on the most recent Mortgage that was taken out on this home.
Original Mortgage
$108,000
Outstanding Balance
$48,593
Interest Rate
4.62%
Mortgage Type
New Conventional
Estimated Equity
$148,091
Purchase Details
Closed on
Jun 14, 1994
Sold by
Combs and Combs C
Bought by
Norvell Michael R and Norvell K
Home Financials for this Owner
Home Financials are based on the most recent Mortgage that was taken out on this home.
Original Mortgage
$57,600
Interest Rate
8.45%
Mortgage Type
New Conventional
Create a Home Valuation Report for This Property
The Home Valuation Report is an in-depth analysis detailing your home's value as well as a comparison with similar homes in the area
Home Values in the Area
Average Home Value in this Area
Purchase History
| Date | Buyer | Sale Price | Title Company |
|---|---|---|---|
| Norvell Michael R | -- | -- | |
| Norvell Michael R | $72,000 | -- |
Source: Public Records
Mortgage History
| Date | Status | Borrower | Loan Amount |
|---|---|---|---|
| Open | Norvell Michael R | $108,000 | |
| Closed | Norvell Michael R | $57,600 | |
| Closed | Norvell Michael R | $23,500 |
Source: Public Records
Tax History Compared to Growth
Tax History
| Year | Tax Paid | Tax Assessment Tax Assessment Total Assessment is a certain percentage of the fair market value that is determined by local assessors to be the total taxable value of land and additions on the property. | Land | Improvement |
|---|---|---|---|---|
| 2024 | $2,116 | $49,450 | $4,760 | $44,690 |
| 2023 | $2,116 | $49,450 | $4,760 | $44,690 |
| 2022 | $1,862 | $37,110 | $3,810 | $33,300 |
| 2021 | $1,887 | $37,110 | $3,810 | $33,300 |
| 2020 | $1,808 | $37,110 | $3,810 | $33,300 |
| 2019 | $1,317 | $25,450 | $3,710 | $21,740 |
| 2018 | $1,322 | $25,450 | $3,710 | $21,740 |
| 2017 | $1,343 | $25,450 | $3,710 | $21,740 |
| 2016 | $1,343 | $25,370 | $3,710 | $21,660 |
| 2015 | $1,347 | $25,370 | $3,710 | $21,660 |
| 2014 | $1,290 | $25,370 | $3,710 | $21,660 |
Source: Public Records
Map
Nearby Homes