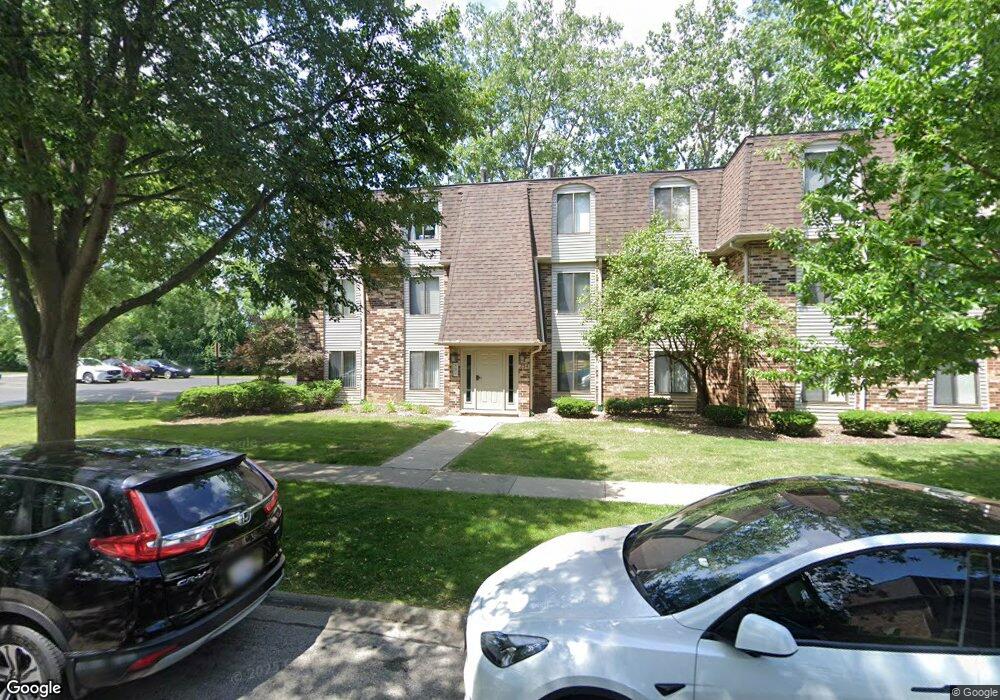
234 W Ct of Shorewood Unit 2B Vernon Hills, IL 60061
Estimated Value: $202,165 - $222,000
--
Bed
2
Baths
935
Sq Ft
$227/Sq Ft
Est. Value
About This Home
This home is located at 234 W Ct of Shorewood Unit 2B, Vernon Hills, IL 60061 and is currently estimated at $212,041, approximately $226 per square foot. 234 W Ct of Shorewood Unit 2B is a home located in Lake County with nearby schools including Country Meadows Elementary School, Woodlawn Middle School, and Adlai E Stevenson High School.
Ownership History
Date
Name
Owned For
Owner Type
Purchase Details
Closed on
Nov 13, 2012
Sold by
Langford Marsha A
Bought by
Langford Michele J
Current Estimated Value
Home Financials for this Owner
Home Financials are based on the most recent Mortgage that was taken out on this home.
Original Mortgage
$46,800
Outstanding Balance
$32,324
Interest Rate
3.38%
Mortgage Type
New Conventional
Estimated Equity
$179,717
Purchase Details
Closed on
Aug 10, 2004
Sold by
Langford Marsha A
Bought by
Langford Michele J and Marsha A Langford Living Trust
Purchase Details
Closed on
Oct 31, 2000
Sold by
Addison Conversion Partners Lp
Bought by
Langford Marsha A
Home Financials for this Owner
Home Financials are based on the most recent Mortgage that was taken out on this home.
Original Mortgage
$102,700
Interest Rate
7.96%
Mortgage Type
FHA
Create a Home Valuation Report for This Property
The Home Valuation Report is an in-depth analysis detailing your home's value as well as a comparison with similar homes in the area
Home Values in the Area
Average Home Value in this Area
Purchase History
| Date | Buyer | Sale Price | Title Company |
|---|---|---|---|
| Langford Michele J | $39,000 | None Available | |
| Langford Michele J | -- | -- | |
| Langford Marsha A | $106,000 | Title Services |
Source: Public Records
Mortgage History
| Date | Status | Borrower | Loan Amount |
|---|---|---|---|
| Open | Langford Michele J | $46,800 | |
| Previous Owner | Langford Marsha A | $102,700 |
Source: Public Records
Tax History Compared to Growth
Tax History
| Year | Tax Paid | Tax Assessment Tax Assessment Total Assessment is a certain percentage of the fair market value that is determined by local assessors to be the total taxable value of land and additions on the property. | Land | Improvement |
|---|---|---|---|---|
| 2024 | $3,645 | $51,379 | $13,147 | $38,232 |
| 2023 | $3,455 | $44,889 | $11,486 | $33,403 |
| 2022 | $3,455 | $41,022 | $10,496 | $30,526 |
| 2021 | $3,333 | $40,580 | $10,383 | $30,197 |
| 2020 | $3,262 | $40,718 | $10,418 | $30,300 |
| 2019 | $3,607 | $45,216 | $10,380 | $34,836 |
| 2018 | $2,197 | $30,705 | $11,282 | $19,423 |
| 2017 | $2,178 | $29,989 | $11,019 | $18,970 |
| 2016 | $2,064 | $28,717 | $10,552 | $18,165 |
| 2015 | $1,996 | $26,856 | $9,868 | $16,988 |
| 2014 | $2,384 | $30,655 | $10,599 | $20,056 |
| 2012 | $2,405 | $30,716 | $10,620 | $20,096 |
Source: Public Records
Map
Nearby Homes
- 239 W Ct of Shorewood Unit 1B
- 229 W Court of Shorewood Unit 3B
- 820 N Lakeside Dr Unit 2D
- 835 Waterview Cir Unit 4
- 835 Waterview Cir Unit 2
- 126 S Fiore Pkwy
- 67 Shelby Ct
- 717 N Lakeside Dr
- 713 N Lakeside Dr
- 210 E Lakeside Dr
- 6421 Collier Cir
- 0 Endwood Dr
- 35 Charles Ct
- 54 N Royal Oak Dr
- 7215 Daybreak Ln
- 234 Us Highway 45
- 291 Hunter Ct
- 1062 Dearborn Ln
- 190 Southgate Dr
- 349 W Pointe Dr
- 234 W Court of Shorewood Unit 3B
- 224 W Ct of Shorewood Unit 1A
- 224 W Ct of Shorewood Unit 3B
- 224 W Ct of Shorewood Unit 3A
- 224 W Ct of Shorewood Unit 2B
- 224 W Ct of Shorewood Unit 2A
- 224 W Ct of Shorewood Unit 1B
- 234 W Ct of Shorewood Unit 3B
- 234 W Ct of Shorewood Unit 3A
- 234 W Ct of Shorewood Unit 2A
- 234 W Ct of Shorewood Unit 1B
- 234 W Ct of Shorewood Unit 1A
- 224 W Court of Shorewood Unit 1A
- 224 W Court of Shorewood Unit 2A
- 224 W Court of Shorewood Unit 3A
- 224 W Court of Shorewood Unit 3B
- 239 W Ct of Shorewood Unit 2B
- 239 W Ct of Shorewood Unit 2A
- 239 W Ct of Shorewood Unit 3B
- 239 W Ct of Shorewood Unit 1A