Estimated Value: $511,000 - $1,920,000
--
Bed
--
Bath
--
Sq Ft
0.76
Acres
About This Home
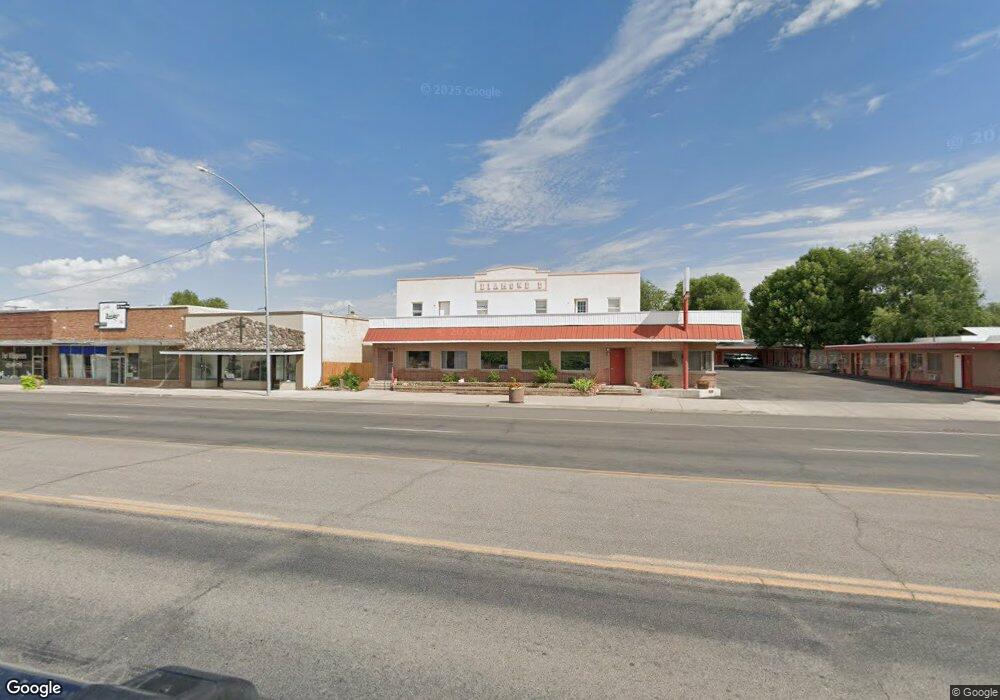
This home is located at 234 W Main St, Delta, UT 84624 and is currently estimated at $1,100,539. 234 W Main St is a home located in Millard County with nearby schools including Cba Center and White River Academy.
Ownership History
Date
Name
Owned For
Owner Type
Purchase Details
Closed on
Sep 2, 2025
Sold by
Shetlin Corina and Shetlin Jay
Bought by
Delta Schitts Creek Llc
Current Estimated Value
Purchase Details
Closed on
Dec 10, 2021
Sold by
Draper Stephne B and Draper Jane Ann
Bought by
Shetlin Jay and Putvin Corina
Home Financials for this Owner
Home Financials are based on the most recent Mortgage that was taken out on this home.
Original Mortgage
$235,000
Interest Rate
3.14%
Mortgage Type
Purchase Money Mortgage
Create a Home Valuation Report for This Property
The Home Valuation Report is an in-depth analysis detailing your home's value as well as a comparison with similar homes in the area
Home Values in the Area
Average Home Value in this Area
Purchase History
| Date | Buyer | Sale Price | Title Company |
|---|---|---|---|
| Delta Schitts Creek Llc | -- | None Listed On Document | |
| Delta Schitts Creek Llc | -- | None Listed On Document | |
| Shetlin Jay | -- | First American Title Insuran |
Source: Public Records
Mortgage History
| Date | Status | Borrower | Loan Amount |
|---|---|---|---|
| Previous Owner | Shetlin Jay | $235,000 |
Source: Public Records
Tax History Compared to Growth
Tax History
| Year | Tax Paid | Tax Assessment Tax Assessment Total Assessment is a certain percentage of the fair market value that is determined by local assessors to be the total taxable value of land and additions on the property. | Land | Improvement |
|---|---|---|---|---|
| 2025 | $8,183 | $875,783 | $82,764 | $793,019 |
| 2024 | $413,463 | $413,463 | $15,822 | $397,641 |
| 2023 | $10,846 | $413,463 | $15,822 | $397,641 |
| 2022 | $6,113 | $460,087 | $62,446 | $397,641 |
| 2021 | $4,236 | $304,344 | $58,026 | $246,318 |
| 2020 | $4,189 | $299,069 | $52,751 | $246,318 |
| 2019 | $3,856 | $275,515 | $51,817 | $223,698 |
| 2018 | $3,825 | $275,627 | $51,929 | $223,698 |
| 2017 | $3,971 | $275,629 | $50,416 | $225,213 |
| 2016 | $3,851 | $275,629 | $50,416 | $225,213 |
| 2015 | $3,848 | $275,629 | $50,416 | $225,213 |
| 2014 | -- | $269,711 | $80,690 | $189,021 |
| 2013 | -- | $273,823 | $84,802 | $189,021 |
Source: Public Records
Map
Nearby Homes