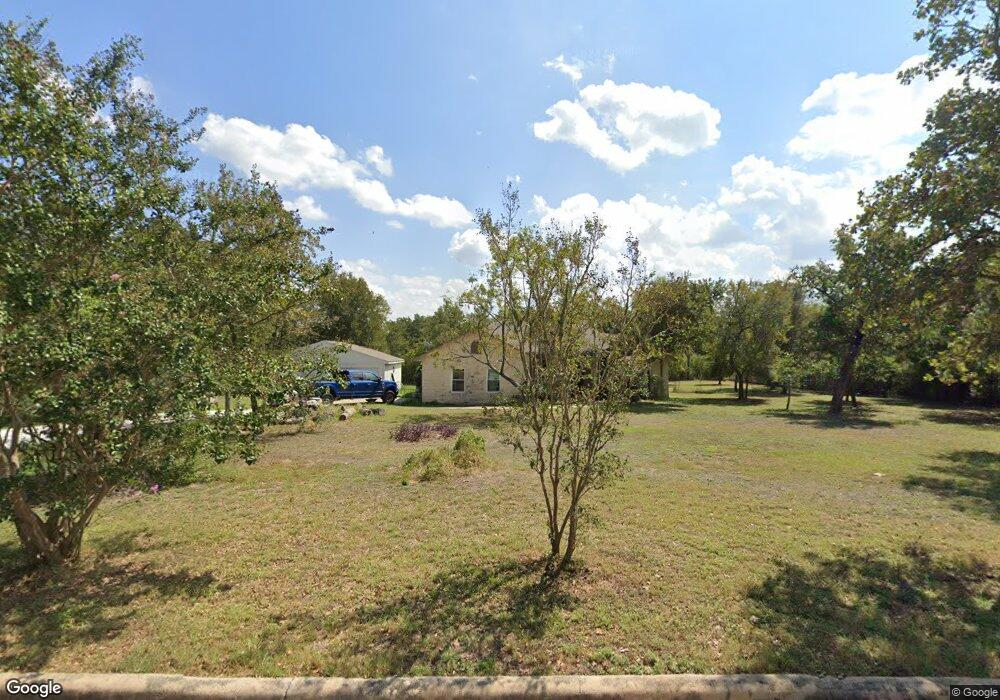
234 W Oak Loop Cedar Creek, TX 78612
Estimated Value: $353,000 - $416,000
3
Beds
2
Baths
1,677
Sq Ft
$233/Sq Ft
Est. Value
About This Home
This home is located at 234 W Oak Loop, Cedar Creek, TX 78612 and is currently estimated at $391,515, approximately $233 per square foot. 234 W Oak Loop is a home located in Bastrop County with nearby schools including Bluebonnet Elementary School, Cedar Creek Middle School, and Cedar Creek Intermediate School.
Ownership History
Date
Name
Owned For
Owner Type
Purchase Details
Closed on
Sep 30, 2013
Sold by
Teran Leticia and Sterman Leticia
Bought by
Sterman Matthew Aaron
Current Estimated Value
Purchase Details
Closed on
Dec 5, 2011
Sold by
Conroy Wes and Conroy Dawn
Bought by
Sterman Matthew
Home Financials for this Owner
Home Financials are based on the most recent Mortgage that was taken out on this home.
Original Mortgage
$194,930
Outstanding Balance
$135,816
Interest Rate
4.4%
Mortgage Type
FHA
Estimated Equity
$255,699
Purchase Details
Closed on
Apr 13, 2005
Sold by
Becan Samuel I and Becan Carol J
Bought by
Conroy Wes
Home Financials for this Owner
Home Financials are based on the most recent Mortgage that was taken out on this home.
Original Mortgage
$123,750
Interest Rate
6.75%
Mortgage Type
Adjustable Rate Mortgage/ARM
Create a Home Valuation Report for This Property
The Home Valuation Report is an in-depth analysis detailing your home's value as well as a comparison with similar homes in the area
Home Values in the Area
Average Home Value in this Area
Purchase History
| Date | Buyer | Sale Price | Title Company |
|---|---|---|---|
| Sterman Matthew Aaron | -- | None Available | |
| Sterman Matthew | $194,930 | Ttt | |
| Conroy Wes | -- | Texas American Title Company |
Source: Public Records
Mortgage History
| Date | Status | Borrower | Loan Amount |
|---|---|---|---|
| Open | Sterman Matthew | $194,930 | |
| Previous Owner | Conroy Wes | $123,750 |
Source: Public Records
Tax History
| Year | Tax Paid | Tax Assessment Tax Assessment Total Assessment is a certain percentage of the fair market value that is determined by local assessors to be the total taxable value of land and additions on the property. | Land | Improvement |
|---|---|---|---|---|
| 2025 | $4,548 | $394,935 | $160,000 | $234,935 |
| 2023 | $4,548 | $329,483 | $0 | $0 |
| 2022 | $4,708 | $299,530 | $0 | $0 |
| 2021 | $5,394 | $299,361 | $75,000 | $224,361 |
| 2020 | $5,052 | $283,698 | $51,998 | $231,700 |
| 2019 | $4,773 | $225,041 | $35,000 | $190,041 |
| 2018 | $5,027 | $237,050 | $35,000 | $202,050 |
| 2017 | $5,003 | $224,458 | $38,500 | $185,958 |
| 2016 | $4,843 | $217,264 | $35,000 | $182,264 |
| 2015 | $3,957 | $187,021 | $35,000 | $152,021 |
| 2014 | $3,957 | $183,190 | $35,000 | $148,190 |
Source: Public Records
Map
Nearby Homes
- 141 N Eskew Ln
- 356 Cedar Ln
- 323 Cedar Ln
- 145 Angelia Dr
- 681 Leisure Ln
- TBD TRACT B McDonald Ln W Unit J
- TBD TRACT A McDonald Ln W Unit J
- 0 McDonald Ln W
- 168 Still Forest Dr
- 376 Jones Rd
- 222 Pope Bend N
- 201 Fawn Ridge Rd
- 537 Leisure Ln
- 175 Fawn Ridge Rd
- 010 Fawn Ridge Rd
- TBD Marjess Dr
- 000 Fawn Ridge Rd
- TBD Tbd Dr
- 195 Tuck St Unit B
- 104 Martin Meadows
- 228 W Oak Loop
- 238 W Oak Loop
- 231 W Oak Loop
- 242 W Oak Loop
- 233 W Oak Loop
- 226 W Oak Loop
- 224 W Oak Loop
- 246 W Oak Loop
- 213 W Oak Loop
- 216 W Oak Loop
- 257 W Oak Loop
- 216 W Oak Loop
- 250 W Oak Loop
- 269 W Oak Loop
- 202 W Oak Loop
- 211 W Oak Loop
- 252 W Oak Loop
- 271 W Oak Loop
- 197 W Oak Loop
- 249 Simpson Ave
Your Personal Tour Guide
Ask me questions while you tour the home.