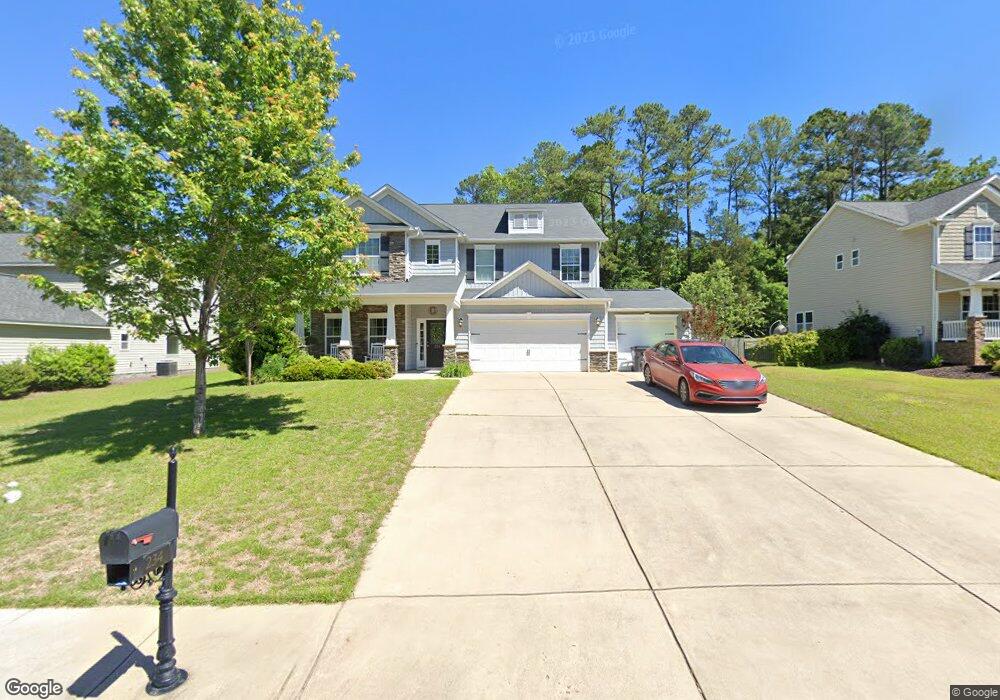
234 Woolbright Ln Chapin, SC 29036
Estimated Value: $452,372 - $480,000
5
Beds
4
Baths
3,729
Sq Ft
$125/Sq Ft
Est. Value
About This Home
This home is located at 234 Woolbright Ln, Chapin, SC 29036 and is currently estimated at $467,843, approximately $125 per square foot. 234 Woolbright Ln is a home located in Lexington County with nearby schools including Lake Murray Elementary School, Chapin Intermediate, and Chapin High School.
Ownership History
Date
Name
Owned For
Owner Type
Purchase Details
Closed on
Jun 22, 2020
Sold by
Manning Molly E and Manning Jeffrety
Bought by
Gaspar Sarah J and Gaspar Bryan W
Current Estimated Value
Home Financials for this Owner
Home Financials are based on the most recent Mortgage that was taken out on this home.
Original Mortgage
$235,920
Outstanding Balance
$209,125
Interest Rate
3.2%
Mortgage Type
New Conventional
Estimated Equity
$258,718
Purchase Details
Closed on
Oct 1, 2012
Sold by
Holiday Builders Inc
Bought by
Manning Jeffrey and Manning Molly E
Home Financials for this Owner
Home Financials are based on the most recent Mortgage that was taken out on this home.
Original Mortgage
$251,362
Interest Rate
3.71%
Mortgage Type
Future Advance Clause Open End Mortgage
Purchase Details
Closed on
Apr 26, 2012
Sold by
Eagles Nest Development Llc
Bought by
Holiday Builders Inc
Create a Home Valuation Report for This Property
The Home Valuation Report is an in-depth analysis detailing your home's value as well as a comparison with similar homes in the area
Home Values in the Area
Average Home Value in this Area
Purchase History
| Date | Buyer | Sale Price | Title Company |
|---|---|---|---|
| Gaspar Sarah J | $294,900 | First American Mortgage Sln | |
| Manning Jeffrey | $264,592 | -- | |
| Holiday Builders Inc | $60,000 | -- |
Source: Public Records
Mortgage History
| Date | Status | Borrower | Loan Amount |
|---|---|---|---|
| Open | Gaspar Sarah J | $235,920 | |
| Previous Owner | Manning Jeffrey | $251,362 |
Source: Public Records
Tax History
| Year | Tax Paid | Tax Assessment Tax Assessment Total Assessment is a certain percentage of the fair market value that is determined by local assessors to be the total taxable value of land and additions on the property. | Land | Improvement |
|---|---|---|---|---|
| 2024 | $2,171 | $11,796 | $1,700 | $10,096 |
| 2023 | $2,002 | $11,796 | $1,700 | $10,096 |
| 2022 | $1,976 | $11,796 | $1,700 | $10,096 |
| 2020 | $2,140 | $12,251 | $1,700 | $10,551 |
| 2019 | $7,354 | $16,492 | $2,700 | $13,792 |
| 2018 | $1,734 | $10,995 | $1,800 | $9,195 |
| 2017 | $1,678 | $10,995 | $1,800 | $9,195 |
| 2016 | $1,717 | $10,994 | $1,800 | $9,194 |
| 2014 | $1,646 | $10,582 | $1,600 | $8,982 |
| 2013 | -- | $15,880 | $2,400 | $13,480 |
Source: Public Records
Map
Nearby Homes
- 715 Soldier Gray Ln
- 208 Woolbright Ln
- 0 Harvest View Rd
- 315 Eagle Claw Dr
- 317 Eagle Claw Dr
- 0 E Boundary St
- 0 Woodthrush Rd
- 120 W Horn Ct
- 118 Pacific Ave
- 115 Merowey Ct
- 100 Recluse St
- 562 Griffon Dr
- 125 Northshore Dr
- 132 Northshore Dr
- 14 Holliston Ct
- 124 Peak St
- 570 Griffon Dr
- 578 Griffon Dr
- 575 Griffon Dr
- 582 Griffon Dr
- 232 Woolbright Ln
- 236 Woolbright Ln
- 230 Woolbright Ln
- 238 Woolbright Ln
- 235 Woolbright Ln
- 233 Woolbright Ln
- 231 Woolbright Ln
- 228 Woolbright Ln
- 602 Muldrow Ln
- 226 Woolbright Ln
- 601 Muldrow Ln
- 604 Muldrow Ln
- 603 Muldrow Ln
- 605 Munldrow Ln
- 605 Muldrow Ln
- 606 Muldrow Ln
- 607 Muldrow Ln
- 220 Woolbright Ln
- 130 Yarabee Ct
- 503 Varsity Ct
Your Personal Tour Guide
Ask me questions while you tour the home.