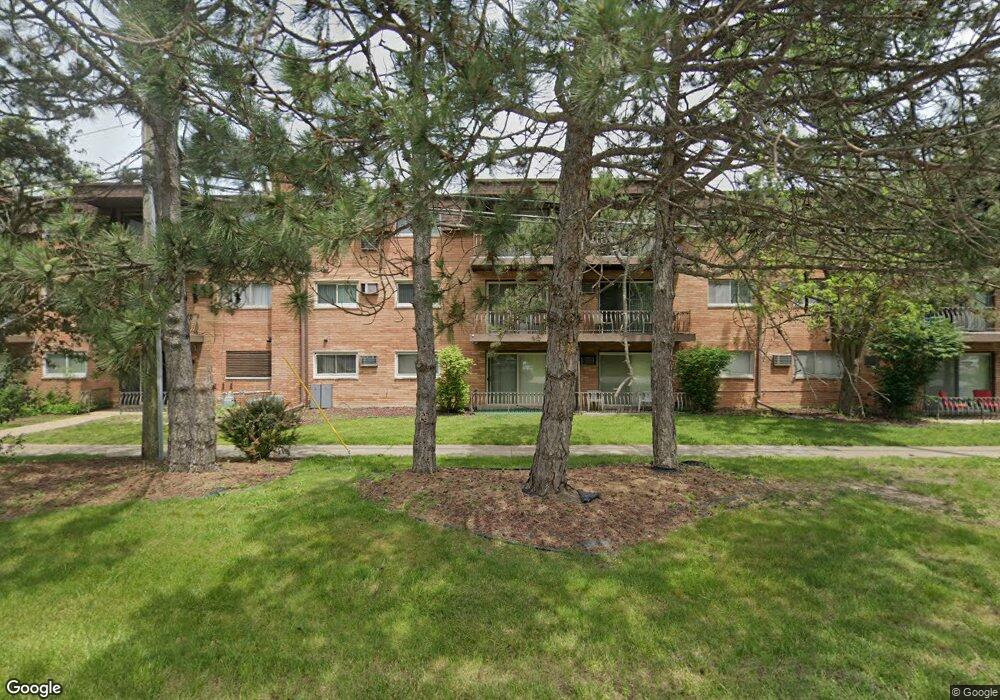
2340 186th St Unit 23 Lansing, IL 60438
Estimated Value: $82,000 - $108,000
2
Beds
1
Bath
1,000
Sq Ft
$92/Sq Ft
Est. Value
About This Home
This home is located at 2340 186th St Unit 23, Lansing, IL 60438 and is currently estimated at $91,587, approximately $91 per square foot. 2340 186th St Unit 23 is a home located in Cook County with nearby schools including Oak Glen Elementary School, Memorial Jr High School, and Thornton Fractnl So High School.
Ownership History
Date
Name
Owned For
Owner Type
Purchase Details
Closed on
Jan 25, 2018
Sold by
Wilmington Savings Fund Society Fsb
Bought by
Yarber Roy B and Yarber Pamela J
Current Estimated Value
Purchase Details
Closed on
Dec 11, 2017
Sold by
Ryan Edward J
Bought by
Wilmington Savings Fund Society Fsb and Stanwich Mortgage Loan Trust B
Purchase Details
Closed on
Nov 19, 2001
Sold by
Balhouse Lorna
Bought by
Ryan Edward J
Home Financials for this Owner
Home Financials are based on the most recent Mortgage that was taken out on this home.
Original Mortgage
$68,350
Interest Rate
6.6%
Mortgage Type
FHA
Purchase Details
Closed on
Apr 13, 2000
Sold by
Balhouse Lorna
Bought by
Livin Balhouse Lorna and Lorna Balhouse Revocable Living Trust
Purchase Details
Closed on
Jun 12, 1995
Sold by
Columbia National Bank Of Chicago
Bought by
Balhouse Lorna
Create a Home Valuation Report for This Property
The Home Valuation Report is an in-depth analysis detailing your home's value as well as a comparison with similar homes in the area
Home Values in the Area
Average Home Value in this Area
Purchase History
| Date | Buyer | Sale Price | Title Company |
|---|---|---|---|
| Yarber Roy B | $22,000 | None Available | |
| Wilmington Savings Fund Society Fsb | -- | None Available | |
| Ryan Edward J | $70,000 | -- | |
| Livin Balhouse Lorna | -- | -- | |
| Balhouse Lorna | $62,500 | -- |
Source: Public Records
Mortgage History
| Date | Status | Borrower | Loan Amount |
|---|---|---|---|
| Previous Owner | Ryan Edward J | $68,350 |
Source: Public Records
Tax History Compared to Growth
Tax History
| Year | Tax Paid | Tax Assessment Tax Assessment Total Assessment is a certain percentage of the fair market value that is determined by local assessors to be the total taxable value of land and additions on the property. | Land | Improvement |
|---|---|---|---|---|
| 2024 | $1,318 | $6,040 | $932 | $5,108 |
| 2023 | $377 | $6,040 | $932 | $5,108 |
| 2022 | $377 | $4,002 | $847 | $3,155 |
| 2021 | $423 | $4,000 | $846 | $3,154 |
| 2020 | $527 | $4,000 | $846 | $3,154 |
| 2019 | $1,406 | $2,470 | $762 | $1,708 |
| 2018 | $1,743 | $3,119 | $762 | $2,357 |
| 2017 | $1,760 | $3,119 | $762 | $2,357 |
| 2016 | $2,019 | $3,692 | $677 | $3,015 |
| 2015 | $1,876 | $3,692 | $677 | $3,015 |
| 2014 | $1,850 | $3,692 | $677 | $3,015 |
| 2013 | $1,159 | $4,425 | $677 | $3,748 |
Source: Public Records
Map
Nearby Homes
- 18550 Torrence Ave Unit 19
- 18550 Torrence Ave Unit 15
- 18518 Glen Oak Ave
- 18508 Torrence Ave
- 2345 185th Ct Unit 25
- 18429 Arcadia Ave
- 2444 187th St
- 18340 Glen Oak Ave Unit 1D
- 18340 Glen Oak Ave Unit 3C
- 2444 187th Place
- 18559 Escanaba Ave Unit 305
- 18307 Locust St
- 18309 Bock Rd
- 2290 182nd Place
- 18235 Exchange Ave
- 18443 De Jong Ln
- 2606 Ridge Rd
- 2643 Ridge Rd
- 2616 Ridge Rd
- 18452 Oakwood Ave
- 2340 186th St Unit 222
- 2340 186th St Unit 220
- 2340 186th St Unit 227
- 2340 186th St Unit 223
- 2340 186th St Unit 216
- 2340 186th St Unit 24
- 2340 186th St Unit 26
- 2340 186th St Unit 219
- 2340 186th St Unit 29
- 2340 186th St Unit 215
- 2340 186th St Unit 221
- 2340 186th St Unit 27
- 2340 186th St Unit 213
- 2340 186th St Unit 22
- 2340 186th St Unit 212
- 2340 186th St Unit 214
- 2340 186th St Unit 218
- 2340 186th St Unit 224
- 2340 186th St Unit 226
- 2340 186th St Unit 229