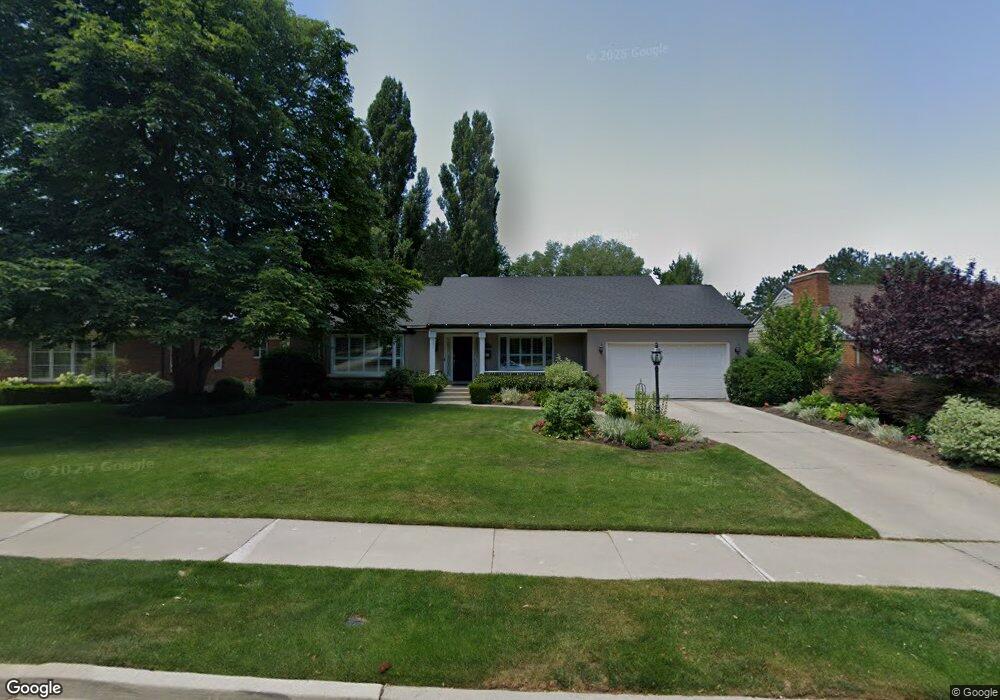
2340 Berkeley St Salt Lake City, UT 84109
Sugar House NeighborhoodEstimated Value: $1,065,000 - $1,324,000
4
Beds
3
Baths
1,442
Sq Ft
$828/Sq Ft
Est. Value
About This Home
This home is located at 2340 Berkeley St, Salt Lake City, UT 84109 and is currently estimated at $1,193,938, approximately $827 per square foot. 2340 Berkeley St is a home located in Salt Lake County with nearby schools including Dilworth Elementary School, Hillside Middle School, and Highland High School.
Ownership History
Date
Name
Owned For
Owner Type
Purchase Details
Closed on
Sep 9, 1999
Sold by
Boyce David B
Bought by
Boyce David B
Current Estimated Value
Purchase Details
Closed on
Jan 15, 1998
Sold by
Mecham Alan F
Bought by
Mecham Ann D
Home Financials for this Owner
Home Financials are based on the most recent Mortgage that was taken out on this home.
Original Mortgage
$64,304
Outstanding Balance
$11,150
Interest Rate
7.13%
Estimated Equity
$1,182,788
Purchase Details
Closed on
Dec 12, 1997
Sold by
Mecham Ann Dunkley
Bought by
Mecham Alan F and Mecham Ann D
Home Financials for this Owner
Home Financials are based on the most recent Mortgage that was taken out on this home.
Original Mortgage
$64,304
Outstanding Balance
$11,150
Interest Rate
7.13%
Estimated Equity
$1,182,788
Purchase Details
Closed on
Jul 12, 1995
Sold by
Mecham Alan F
Bought by
Mecham Ann D
Home Financials for this Owner
Home Financials are based on the most recent Mortgage that was taken out on this home.
Original Mortgage
$64,304
Interest Rate
7.74%
Create a Home Valuation Report for This Property
The Home Valuation Report is an in-depth analysis detailing your home's value as well as a comparison with similar homes in the area
Home Values in the Area
Average Home Value in this Area
Purchase History
| Date | Buyer | Sale Price | Title Company |
|---|---|---|---|
| Boyce David B | -- | Backman Stewart Title Servic | |
| Mecham Ann D | -- | -- | |
| Mecham Alan F | -- | -- | |
| Mecham Ann D | -- | -- |
Source: Public Records
Mortgage History
| Date | Status | Borrower | Loan Amount |
|---|---|---|---|
| Open | Mecham Ann D | $64,304 | |
| Previous Owner | Mecham Ann D | $64,304 | |
| Closed | Mecham Ann D | $50,000 |
Source: Public Records
Tax History Compared to Growth
Tax History
| Year | Tax Paid | Tax Assessment Tax Assessment Total Assessment is a certain percentage of the fair market value that is determined by local assessors to be the total taxable value of land and additions on the property. | Land | Improvement |
|---|---|---|---|---|
| 2025 | $4,897 | $1,018,500 | $559,000 | $459,500 |
| 2024 | $4,897 | $934,300 | $533,500 | $400,800 |
| 2023 | $4,665 | $857,900 | $513,000 | $344,900 |
| 2022 | $5,055 | $872,300 | $502,900 | $369,400 |
| 2021 | $4,454 | $695,900 | $408,700 | $287,200 |
| 2020 | $4,448 | $661,500 | $382,000 | $279,500 |
| 2019 | $4,663 | $652,300 | $371,400 | $280,900 |
| 2018 | $4,378 | $596,500 | $371,400 | $225,100 |
| 2017 | $4,452 | $568,200 | $371,400 | $196,800 |
| 2016 | $4,597 | $557,200 | $371,400 | $185,800 |
| 2015 | $5,488 | $630,500 | $363,900 | $266,600 |
| 2014 | $5,439 | $619,800 | $363,900 | $255,900 |
Source: Public Records
Map
Nearby Homes
- 2041 E Ashton Cir
- 2157 S Dallin St
- 2050 E Wilmington Ave
- 2275 S 2000 E
- 2213 E 2100 S
- 2532 Maywood Dr
- 2267 E 2700 S
- 2109 S Texas St
- 1925 E Hillcrest Ave
- 2285 S 1900 E
- 2119 King St
- 2261 E Redondo Ave S
- 2313 Wellington St E
- 2505 E Elm Ave
- 2236 E Vimont Ave
- 1865 E Hillcrest Ave
- 2225 Ramona Ave
- 2173 Claybourne Ave
- 2665 Parleys Way Unit 111
- 1838 E Hillcrest Ave
- 2330 Berkeley St
- 2350 Berkeley St
- 2337 S 2200 E
- 2316 Berkeley St
- 2327 S 2200 E
- 2205 Country Club Dr
- 2360 Berkeley St
- 2335 Berkeley St
- 2349 Berkeley St
- 2327 Berkeley St
- 2327 S Berkeley St
- 2310 Berkeley St
- 2313 S 2200 E
- 2361 Berkeley St
- 2313 Berkeley St
- 2304 Berkeley St
- 2301 S 2200 E
- 2175 Country Club Dr
- 2342 Dallin St
- 2324 S 2200 E